![]()
![]()
![]()
Use LEFT and RIGHT arrow keys to navigate between flashcards;
Use UP and DOWN arrow keys to flip the card;
H to show hint;
A reads text to speech;
63 Cards in this Set
- Front
- Back
|
Number of species in a community |
Species richness |
|
|
Proportion of individuals in a community represented by each species |
Relative abundance |
|
|
Curve that plots relative abundance of each species in rank order from most abundant to least abundant |
Rank-abundance curve |
|
|
Measure of the difference in relative abundances of species in a community |
Species evenness |
|
|
What does the slope represent in a in a relative abundance vs. ranked abundance graph? |
The slope= eveness |
|
|
What does going from left to right represent in a in a relative abundance vs. ranked abundance graph? |
The higher species richness going this way ------> |
|
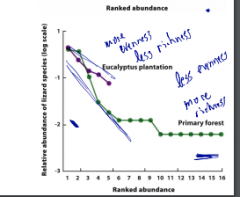
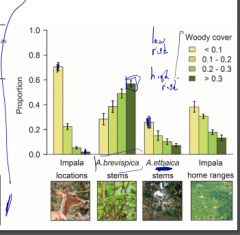
In terms of evenness and richness describe this graph? |
The purple line has more evenness less richness but the green line has less evenness and more richness |
|
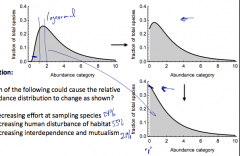
Which of the following could cause the relative abundance distribution to change as show? |
Decreasing effort at sampling species |
|
|
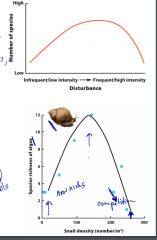
If you increase resources and increase biomass, what are the two pathways that diversity can take? |
It can either increase because there are more niches, or it can decrease because more competition selects for better competitors |
|
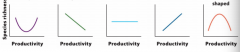
What are the five pathways that effect of resource on diversity can have? |
U-shaped, Negative, None, Positive, Hump-shaped |
|
|
Which type of shape seems to have the most positive effect on on diversity? |
Hump-shap[d
|
|
|
What do experiments that manipulate productivity by adding nutrients to an ecosystem commonly cause? |
A decline in the species richness of producers |
|
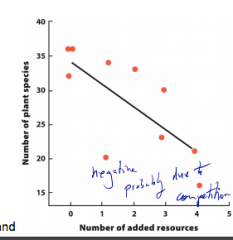
What is happening in this graph? |
As more resources are added, it becomes negative, thus there is more competition among the plants |
|
|
Why do species richness decline with increases in habitat fertility? |
Competition |
|
|
Why could communities with a higher diversity of habitats increase diversity? |
They should offer more potential niches and higher diversity of species |
|
|
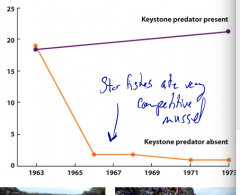
Species whose presence substantially affects the abundance of other species in the community |
Keystone species |
|
|
What is an example of a keystone species and why? |
Pisaster starfish, east mussels, barnacles, limpets and it affects the abundance of other species |
|
|
Graph of Keystone species |
|
|
|
Keystone species that affect communities by influencing the structure of a habitat |
Ecosystem engineers |
|
|
What do ecosystem engineers do? |
Niche construction |
|
|
Diversity highest when disturbance intermediate |
Intermediate disturbance hypothesis |
|
|
What are some examples of disturbances? |
Fires, floods, tornadoes, land use change |
|
|
Graph of intermediate disturbance hypothesis |
|
|
|
One linear part of a web |
Food chain |
|
|
organisms that eat at the same levels (same level organisms in a food web) |
Trophic level |
|
|
What are some trophic level examples? |
Producers, consumers, |
|
|
What level has the most biomass in a food web? |
Grassese and the bottom (the producers) |
|
|
Levels of a food web |
Producers at the bottom, then consumers like the red squirrel or snowshoe hare and then the 2 prime consumers like a wolf |
|
|
Food web |
The interactions and relationships among different species and species levels as it relates to food consumption |
|
|
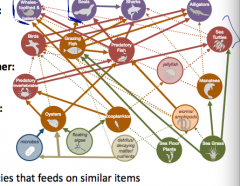
Within a level, species that feeds on similar items |
Guild |
|
|
Levels of food web |
Producers, Primary consumers, secondary consumers, tertiary consumers at the top |
|
|
Chesapeake Bay Food Web Example |
|
|
|
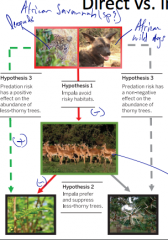
Interaction between two species that does not involve other species |
Direct effect |
|
|
Interaction between two species that involves one or more intermediate species |
Indirect effect |
|
|
Indirect effects in a community that are initiated by a predator |
Trophic cascade |
|
Question: (1) Solid = ? (II) Dashed= ? (III) Red =? (IV) Green = ? |
(I) Direct (II) Indirect (III) = - (IV)= + |
|
|
Proportion of animals in direct vs. indirect effects |
|
|
|
Indirect effect caused by changes in density of an intermediate species |
Density- mediated indirect effect |
|
|
Indirect effect caused by changes in traits of an intermediate species |
Trait mediated indirect effect |
|
|
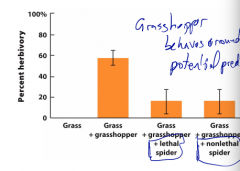
What happens in some habitats if you increase spiders? |
Decrease in grasshoppers and an increase in grass |
|
|
Example of how grasshopper behaviors change according to potential predatros |
|
|
|
Abundances of trophic groups determined by the amount of energy available from producers |
Bottom-up control |
|
|
Abundances of trophic groups determined by the existence of predators at the top of the food web |
Top-down control |
|
|
Another way to describe bottom up |
Producers on up |
|
|
Another way to describe top down control |
From predator down |
|
|
Ability of a community to maintain a particular structure |
Community stability |
|
|
Amount a community resists changes when acted upon by a distrubance |
Community resistance |
|
|
Speed of return of a community to its original state after a disturbance |
Community resilience |
|
|
After disturbance to species composition, new community structure forms and is resistant to further change |
Alternative stable state |
|
|
When does succession occur in a community? |
When species replace each other over time |
|
|
T or F: succession always occurs through different mechanisms |
False, can occur through different ones |
|
|
T or F: Succession always produces a single climax community |
False, does not always produce a single climax community |
|
|
Species composition of a community changes over time |
Succesion |
|
|
A seral community is what? |
is an intermediate stagefound in ecological succession in an ecosystem advancing towards its climax community. In many cases more than one seral stage evolves until climax conditions are attained. |
|
|
Earliest species to arrive at a site |
Pioneer species |
|
|
Final stage in succession |
Climax community |
|
|
What is the first seral stage? |
Bare rock, no soil |
|
|
What is the Final seral stage? |
Stable community composition |
|
|
What is the clearest way to record succession in a community? |
Direct observation of changes over time |
|
|
What is a modern example of observing succession? |
Mt St. Helens from 1980 to now has moved toward its climax plant communities |
|
|
What is an early example of observing succession? |
Krakatu shrinking island boundary |
|
|
a sequence of communities that exist over time at a given location |
Chronosequence |
|
|
What has happened at the dunes at Lake Michigan? |
lakes have lowered, and it has moved closer to climax community |