![]()
![]()
![]()
Use LEFT and RIGHT arrow keys to navigate between flashcards;
Use UP and DOWN arrow keys to flip the card;
H to show hint;
A reads text to speech;
45 Cards in this Set
- Front
- Back
|
Elasticity |
a measure of responsiveness to change Helps businesses and governments make better decisions and it helps producers maximize their reveneus |
|
|
Price elasticity of demand |
measures the responsiveness of quantity demanded due to a change in price |%^Q/%^P| not negative. LOD - Demand falls, price increases |
|
|
Pure number |
No units, allows to compare elasticities without worrying |
|
|
Demand is Elastic |
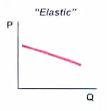
When Ed > 1 |
|
|
Demand is inelastic |
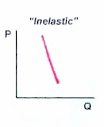
when Ed < 1 |
|
|
Demand is Unit Elastic |
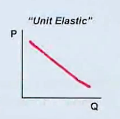
when ED = 1 |
|
|
Demand is perfectly elastic |
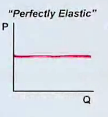
When ED = infinity |
|
|
Demand is perfectly inelastic |
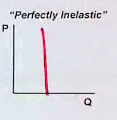
Ed = 0 |
|
|
Existence of close substitutes |
Demand is more elastic when there are more close substitutes Diet Coke vs. insulin |
|
|
Necessity or Luxury |
Demand is more elastic for luxury goods than for nevessities |
|
|
Share of income spent on the good |
demand is more elastic if a larger share of income is spent on the good |
|
|
Time to adjust to a price change |
Demand is more elastic if people have longer to adjust to a price change |
|
|
Midpoint formula |
%^Qd = End value - Beginning Value / Average %^P = End Value - Beginning Value / Average ED = |%^Qd/%^P| |
|
|
Assuming a straight-line demand curve, the price elasticity of demand is |
0 at the horizontal intercept infinity at the vertical intercept 1 at the midpoint |
|
|
If demand is inelastic, increasing price ________ Total Revenues TR = P x Q |
Increases |
|
|
If demand is elastic, increasing price _______ Total revenues |
Decreases |
|
|
Price elasticity of supply |
measures the responsiveness of quantity supplied to a change in price %^Qs/%^P Always positive
|
|
|
Cross-price elasticity |
Measures the responsiveness of the quantity demanded for one good to a change in the price of a related good Ecp = %^QDa/ %^Pb This measure is + for substitutes and - for compliments 0 for unrelated goods |
|
|
income elasticity of demand |
measures the responsiveness of the quantity demanded to a change in income %^QB/%income + for normal goods and - for inferior goods |
|
|
If E1 > 1 |
the good is a luxury good |
|
|
If 0 < E1 < 1 |
the good is a necessity |
|
|
They take an action when the marginal benifit |
exceeds or = to the marginal cost |
|
|
Marginal cost |
is the additional cost that making that decision entailes ^TC/^Q usually increases as quantity increases |
|
|
Marginal benefit |
is the additional benefit that making that decision entails ^TB / ^Q usually decreases as the quantity increases |
|
|
budget line |
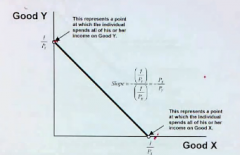
shows all the maximum bundles of two goods that a consumer can afford, assuming that he or she spends all of his or her entire budget. it tells us nothing about preferences They have negative slopes slopes are constant tells us about affordability |
|
|
The vertical intercept represents the maximum affordable quantity of the good listed along the vertical, assuming the consumer spends |
all of his or her income on that good |
|
|
The horizontal intercept represents the maximum affordable quantity of the good listed along the horizontal, assuming the consumer spends |
all of his of her income on that good |
|
|
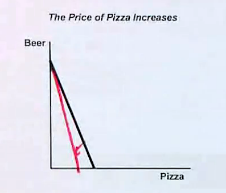
The price of Beer increases |
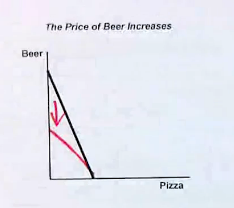
demand decreases inward and the budget line gets flatter |
|
|
The Price of beer decreases |
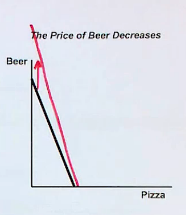
Demand increases outward |
|
|
The price of pizza increases |
|
|
|
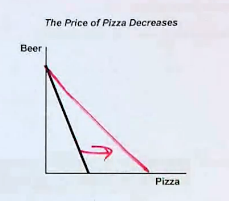
The price of pizza decreases |
|
|
|
Your income decreases |
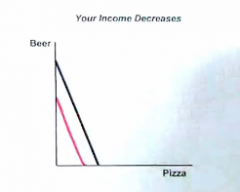
Shifts inward in a parallel fashtion
|
|
|
Your income increases |
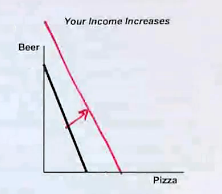
Shifts outward in a parallel fashion
|
|
|
Utility |
a fancy economics term for hapiness |
|
|
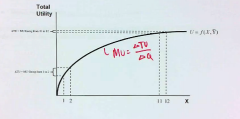
Total utility |
the aggregate measure of happiness |
|
|
Marginal utiltiy |
the additional utility derived from consuming one more unit MU = ^TU/^Q |
|
|
law of diminishing marginal utility |
marginal utility of consuming an additional unit decreases as the quantity increases. |
|
|
"Bang for your buck" |
is equal to the marginal utility derived from consuming the good, divided by the price of the good. Mu/P |
|
|
Optimal consumption rule |
rational decision makers consume the bundle of goods for which MU/P is equal to all goods example: MU/P pizza = MU/P soda MU/P pizza = MU/P soda = MU/P breadsticks |
|
|
The consumer will respond by buying |
more of good A and less of good B MUa/MUpa = MUb/Pb If Firm A advertises effectively, its MU increases: MUa/Pa > MUb/Pb |
|
|
The consumer will respond by buying |
Less of Good A MUa/Pa = MUb/Pb If the price of Good a increses: MUa/Pa < MUb/Pb |
|
|
Consumer Choice Model |
explains how people make rational decisions People want to maximize their utility People have preferences (indifference curves) People have income constraints (budget lines) |
|
|
Utility function |
represents the relationship between total utility and the quantity of a good consumed U = f(X,Y) < General U = 4X + 6Y < linear U = 4X^1/2 * 6Y^1/2 < non-linear |
|
|
indifference curve |
reflects combinations of two goods among which the consumer is indifferent. Higher indifference are associated with higher levels of utility There is an infinite number of indifference curves USUALLY have negative slopes. Unless one good is an economic good and another is an economic bad cannot cross |
|
|
indifference function |
from a utility function by holding utility constant and solving for one of the goods U = 4X + 6Y U - 4x = 6y U - 4x / 6 = y |