![]()
![]()
![]()
Use LEFT and RIGHT arrow keys to navigate between flashcards;
Use UP and DOWN arrow keys to flip the card;
H to show hint;
A reads text to speech;
31 Cards in this Set
- Front
- Back
|
How many islands make up the Pacific and what 3 groups can pacific people be divided into? |
About 22 islands in the Pacific. Can be divided into 3 groups of people: 1.) Polynesia (Samoa, Tonga, Cook islands) 2.) Micronesia (closer to the US) 3.) Melanesia (Fiji, Papa new guinea) |
|
|
What is technically the northern most city of New Zealand and why? |
Tokelau. People born in Tokelau, Niue, Cook islands and Samoa are automatically NZ citizens |
|
|
What was a critical result of people traveling in and out of the Pacific nations a while ago? Give a key example |
Indigenous populations had hardly any resistance/immunity to infectious diseases. A foreign trading ship caused the flu epidemic in Samoa in 1918 that killed 20% of the population |
|
|
What are the reasons people migrated from the Pacific to NZ? |
1.) Employment: 1950s economic boom, actively recruiting from islands for unskilled labour 2.) Education |
|
|
How much of NZs populations is Pacific people? |
7.4% of the total population. Heterogenous (from many different islands). 62% born in NZ |
|
|
Describe the age distribution among Pacific and Maori people |
Mostly younger people as apposed to older in European populations. Median age is 21 |
|
|
Describe one Pacific model of health and give its name |
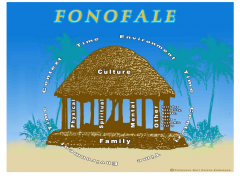
Family on bottom. Pillars are physical, spiritual, mental and other (age, SES, gender etc). Top is culture. Around is context, time and environment. Called the Fonofale model |
|
|
What is Pacific peoples life expectancy in relation to European people? |
Expected to live 5 years less |
|
|
Give examples of key diseases in relation to Pacific health |
cardiovascular disease, cerebrovascular disease, diabetes type 2, lung cancer in men, breast cancer in women, rheumatic fever, respiratory diseases in children, |
|
|
What are the socioeconomic determinants of health? |
Income, education, employment, housing |
|
|
What are the challenges to overcome when it comes to Pacific health? |
Convenience and affordability |
|
|
What is the best way forward/approach in improving Pacific health? |
Collective action approach - Involving many different people on multiple levels. Government, community health boards, health providers, families, individuals etc |
|
|
What are the 3 major points of the treaty of Waitangi? |
1.) Maori cede sovereignty to the British crown 2.) Maori guaranteed full ownership and use of their lands and possessions (can only sell to the crown) 3.) Maori enjoy the same rights and privileges as British citizens |
|
|
Give a few reasons why measuring Maori health is important? |
Maori are the indigenous people, need to understand their needs, differences and priorities. To monitor their trends/status over time. Can help inform policy and practices. Can assess the impacts of interventions. Have a responsibility to Maori in relation to the Treaty. |
|
|
How do Statistics NZ define ethnicity? |
Ethnicity is simply the ethnic group(s) that people identify with. A measure of cultural affiliation not race, ancestry or nationality. |
|
|
What proportion of NZ people identify as Maori? |
About 14.9% but that number is increasing |
|
|
Describe the geographic distribution of Maori |
Mostly (~85%) live in the north island and in urban areas. Auckland, Waikato, Bay of Plenty and Wellington |
|
|
Describe one key Maori health model |
Hauora = well-being 1.) Taha Wairua = spiritual 2.) Taha Hinengaro = mental and emotional 3.) Taha Whanau = family and social 4.) Taha Tinana = physical |
|
|
Describe analytic epidemiology |
Analytic epidemiology seeks to quantify the degree to which an exposure increases or decreases the likelihood of the outcome |
|
|
What are the 4 study designs that can be classed as analytic? |
Randomised controlled trial, case controlled, cohort and cross-sectional/ecological (these can also be descriptive) |
|
|
What does PECOT stand for? |
Popuation, Exposure, Comparison, Outcome, Time |
|
|
In the GATE frame the population can be split into what 2 groups? |
1.) Source = population the sample is recruited from 2.) Sample = population group included in your study |
|
|
Define relative risk |
It is a ratio of incidence and quantifies how many times as likely the exposed group is to develop the outcome than the comparison group. |
|
|
Which incidence can you use to calculate relative risk? |
Either, as long as you are using either both cumulative incidences or incidence rate |
|
|
What is the equation used to calculate relative risk? |
Relative risk = incidence of exposed/incidence of comparison |
|
|
What does RR=1, RR<1 and RR>1 mean? |
RR=1 : no association, null value RR>1 : greater likelihood of outcome in exposed, risk factor RR<1 : greater likelihood of outcome in comparison, protective factor |
|
|
How do you interpret relative risk? |
The exposed group were value times AS LIKELY to develop the outcome compared to the comparison group |
|
|
What are the key numbers in determining the strength of the association using relative risk? |
RR>2, moderately strong association RR>5, strong association |
|
|
How does Null value in RR derive from? |
Same incidence of outcome> equal likelihoodof outcome in both group > exposure doesn’t change likelihood ofoutcome, so no association between exposure and outcome; This is the Null Value |
|
|
How does the Risk Factor in RR derive from? |
Greater incidence of outcome in exposed group> greater likelihood of outcome in exposed group > if outcome is bad, exposure is potentially risk factor for the outcome |
|
|
How does the Protective factor in RR derive from? |
Greater incidence of outcome in comparison group > greater likelihood of outcome in comparison group > if outcome is bad, exposure is potentially a protective factor for the outcome |