![]()
![]()
![]()
Use LEFT and RIGHT arrow keys to navigate between flashcards;
Use UP and DOWN arrow keys to flip the card;
H to show hint;
A reads text to speech;
70 Cards in this Set
- Front
- Back
|
core-periphery model |
the distribution of economic, political, and cultural power between dominant core regions, semi-periphery areas, and the periphery; more development in the cores; Map Scale is ratio of distance on map to distance on Earth; Map Projections show Earth's surface on a flat surface; 3 models of map projections - conic, cylindrical, planar; each map projection has advantages and disadvantages |
|
|
core-periphery map scale |
|
|
|
Peters Projection |
a cylindrical map projection that attempts to retain the accurate sizes of all the world's landmasses |
|
|
Mercator projection |
shows true direction and land shapes fairly accurately, but not size or distance. Areas that are located far from the Equator are quite distorted on this type of map. |
|
|
Fuller projection |
Maintains the accurate size and shape of landmasses. Rearranges direction so the cardinal directions no longer have any meaning |
|
|
Goodes-Homosline Projection |
A map projection that preserves area but breaks up the oceans. |
|
|
Robinson Projection |
useful for displaying info across oceans; however, the disadvantage is that the area of land is much smaller. |
|
|
Scale |
the relationship between the size on a map and the size on earth |
|
|
Isoline Map |
a thematic map with lines that connect points of equal value. |
|
|
Cartogram |
a map that has been simplified to present a single idea ina diagrammatic way: the base is not normally true to scale. |
|
|
Dot density map |
a maptype that uses a dot symbol to show the presence of a feature or phenomenon. Dot maps rely on a visual scatter to show spatial pattern. |
|
|
Proportional symbol map |
Map that uses some symbol to display the frequency of a variable. The larger the symbol on the map, the higher the frequency of the variable found in that region |
|
|
Chloropleth map |
a map that uses differences in shading, coloring, or the placing of symbols within predefined areas to indicate the average values of a property or quantity in those areas. |
|
|
Malthus Population Catastrophe |
a prediction of a forced return to subsistence-level conditions once population growth had outpaced agricultural production. A chart of estimated annual growth rates in world population, 1800–2005. |
|
|
Neo-Malthusians |
Advocacy of population control programs to ensure enough resources for current and future populations. |
|
|
Boserup's Hypothesis of Population (anti-Malthusian) |
Population growth compels subsistence farmers to consider new farming approaches that produce enough food to take care of the additional people. |
|
|
Population pyramid components |
Shows the percentage of the total population in each age bracket and by gender groups. Displays it in 5 year age group age youngest group 0-4 at the base to oldest group at the top. The length -% population . Males shown usually on the left side and female on right.The shape of pyramid is determined primarily by the CBR in the community. |
|
|
population pyramid example shapes |
|
|
|
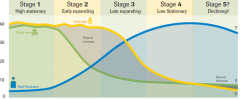
Demographic Transition Model (DTM) |
Seeks to explain the transformation of countries from having high birth and death rates to low birth and death rates. In developed countries this transition began in the eighteenth century and continues today. Less developed countries began the transition later and are still in the midst of earlier stages of the model. |
|
|
DTM visual |
|
|
|
Epidemiological transition model |
essentially the same thing as the demographic transition, however it specifically denotes a human phase of development witnessed by a sudden and stark increase in population growth rates brought about by medical innovation in disease or sickness therapy and treatment, followed by a re-leveling of population growth from subsequent declines in procreation rates. |
|
|
Epidemiological transition model visual |
|
|
|
Gravity Model of Spatial Interaction |
estimates the flow of people, material or information between locations in geographic space. Factors can include origin propulsive variables such as the number of commuters in residential areas, destination attractiveness variables such as the amount of office space in employment areas, and proximity relationships between the locations measured in terms such as driving distance or travel time. |
|
|
Ravenstein's Laws of Migration |
Ravenstein created 11 "laws" that pertained to migration, explaining why and who would migrate; determined that most migrants travel within their country (short distance), long distance travelers usually travel to a large city; rural populations are move likely to move to urban areas; individuals migrate more than families; every migration causes a counterstream; most migrants are young males seeking work |
|
|
Zelinsky Model of Migration Transition |
This model is based off the DTM and focuses on migration patterns. Stage 1 - seasonal/cyclic movement; Stage 2 - most migration seen (international or rural to urban); Stage 3-4 - internal migration (suburbanization) |
|
|
MTM visual |
|
|
|
Indo-European Language |
world's largest language family; spoken by almost half of the world's population; includes Germanic, Romance, Balto-Slavic, Indo-Iranian language branches and the language groups associated with those branches |
|
|
I-E Language Diffusion Theories (Agriculture, Conquest) |
states that the Indo-European languages came from the Proto-Indo-European, a common ancestral language. There are two theories of diffusion. The Agricultural Theory states that the speakers lived in Anatolia, Turkey and diffused west with agricultural innovations; however, the Conquest Theory states that the Kurgans of Russia were nomadic herders who migrated and conquered the areas of that their animals grazed upon |
|
|
Domino Theory |
the theory that a political event in one country will cause similar events in neighboring countries, like a falling domino causing an entire row of upended dominoes to fall. |
|
|
Heartland Theory |
claimed whichever state controlled the resource-rich “heartland” of Eastern Europe could eventually dominate the world. It would suggest that not the United Kingdom (an ocean-based empire), but Russia (which was becoming communist) would be in a position to achieve this dominance. "Who rules East Europe commands the Heartland; who rules the Heartland commands the World-Island (Europe, Asia & Africa); who rules the World-Island controls the world." |
|
|
Rimland Theory |
a concept championed by Nicholas John Spykman, professor of international relations at Yale University. To him geopolitics is the planning of the security policy of a country in terms of its geographical factors. He described the maritime fringe of a country or continent; in particular the densely populated western, southern, and eastern edges of the Eurasian continent. |
|
|
Rank Size Rule |
A pattern of settlements in a country, such that the nth largest settlement is 1/n the population of the largest settlement. |
|
|
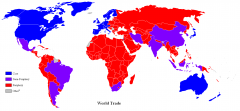
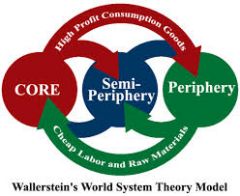
World Systems Theory (Wallerstein) |
Core regions make decisions for the world, semi-periphery make decisions for themselves and the areas around them, periphery areas are dominated by core and semi-periphery, have little influence |
|
|
WST visual |
|
|
|
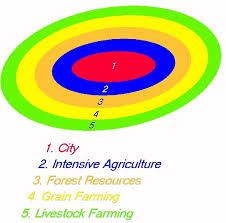
von Thünen's Agricultural Model |
explains and predicts agricultural land use patterns in a theoretical state by varying transportation cost. Given the model's assumptions, the pattern that emerges predicts more-intensive rural land uses closer to the marketplace, and more-extensive rural land uses farther from the city's marketplace. These rural land use zones are divided in the model into concentric rings. |
|
|
von Thunen visual |
|
|
|
First Agricultural Revolution |
Dating back 10,000 years, the First Agricultural Revolution achieved plant domestication and animal domestication |
|
|
Second Agricultural Revolution |
dovetailing with and benefiting from the Industrial Revolution, improved methods of cultivation, harvesting, and storage of farm produce |
|
|
Third Agricultural Revolution |
currently in progress, development of genetically modified organisms |
|
|
Liberal Models of Development (self-sufficiency / international trade) |
Some countries execute self-sufficiency, especially after and during the Great Depression. Countries rely on their own production and population to suffice and economically progress - no imports (taxed), more domestic economic activity, etc. Other countries execute international trade for their economies. Countries trade among themselves, exporting more than importing, lowering trade barriers, etc. |
|
|
Structuralist Model of Development (dependency theory) |
MDCs will help an LDC financially and grant debt relief; however, the LDC must submit a Policy Framework Paper, outlining the economic goals, strategies, objectives, and financing requirements for the LDC. Usually also includes requirements like equal spread of financial help to the LDC, more productive private sector, government reform, etc. |
|
|
New International Division of Labor |
Transfer of some types of jobs, especially those requiring low-paid, less-skilled workers, from more developed to less developed countries. |
|
|
Rostow's Stages of Growth (Modernization Model) |
This model has stages similar to the DTM. The five stages are Traditional Society, Pre-Take Off Stage, Take-Off Stage, Drive to Maturity, High Mass Consumption. This focuses on development stages within a nation and closely related to the stages of the DTM. |
|
|
Fordism |
Form of mass production in which each worker is assigned one specific task to perform repeatedly. |
|
|
Post-Fordism |
Adoption by companies of flexible work rules, such as the allocation of workers to teams that perform a variety of tasks. |
|
|
Location Interdependence Theory (Hotelling) |
suggests competitors, in trying to maximize sales, will seek to constrain each other's territory as much as possible which will therefore lead them to locate adjacent to one another in the middle of their collective customer base. |
|
|
Weber Model of Industrial Location (Least Cost Theory) |
states that the location of manufacturing establishments is determined by the minimization three critical expenses: labor, transportation, and agglomeration. |
|
|
Least Cost Theory visual |
|
|
|
Profit Maximization (Losch’s Zone of Maximization) |
August Lösch's theory analyzes an area of the market that produces the most profit. Instead of relying on one specific location or point of profit, an industry should determine a region or optimal locations that would allow for maximizing profits as much as possible. This theory also considers consumer demand and production costs while accounting for the substitution principle. In Lösch's theory, there are assumptions of an isotropic plain, rational consumers, evenly distributed population, uniform demand, consumer payments of shipping costs, and the possibility of new production plants into the market. With all this in mind, there is a "zone of profitability" (Spatial Margin of Profitiability) in which the greatest net profit for industry is possible. |
|
|
Bid-Rent Theory (Land Rent) |
geographical economic theory that refers to how the price and demand on real estate changes as the distance towards the Central Business District (CBD) increases. |
|
|
Bid-Rent Theory visual |
|
|
|
Borchert’s Model of Urban Evolution |
refer to four distinct periods in the history of American urbanization. Each epoch is characerized by the impact of a particular transport technology on the creation and differential rates of growth of American cities. |
|
|
Central Place Theory (Christaller) |
seeks to explain the number, size and location of human settlements in an urban system. The theory was created by the German geographer Walter Christaller, who asserted that settlements simply functioned as 'central places' providing services to surrounding areas |
|
|
Central Place Theory |
|
|
|
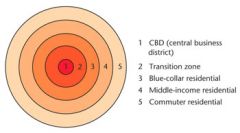
Concentric Circle (Burgess) |
A model of the internal structure of cities in which social groups are spatially arranged in a series of rings. |
|
|
Concentric Circle visual |
|
|
|
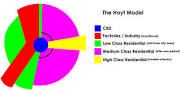
Sector Model (Hoyt) |
Focuses on residential patterns explaining where the wealthy in a city choose to live. He argued that the city grows outward from the center, so a low-rent area could extend all the way from the CBD to the city's outer edge, creating zones which are shaped like pieces of a pie. |
|
|
Sector Model visual |
|
|
|
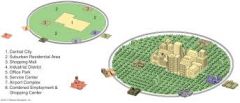
Peripheral Model |
A model of North American urban areas consisting of an inner city surrounded by large suburban residential and business areas tied together by a beltway or ring road. |
|
|
Peripheral Model visual |
|
|
|
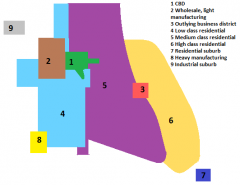
Multiple-Nuclei Model |
A model of the internal structure of cities in which social groups are arranged around a collection of nodes of activities. |
|
|
Multiple-Nuclei visual |
|
|
|
Urban Realms Model |
Developed in 1970s to explain the increase in suburbanization/counter urbanization. As cars and more personal transportation became available, suburbs increased in population since people could commute easily to the CBD and still live with a more relaxed lifestyle. |
|
|
Urban Realms Model visual |

|
|
|
Latin American Cities Model |
Developed by Ernst Griffin and Larry Ford. Blends traditional Latin American culture with the forces of globalization. The CBD is dominant; it is divided into a market sector and a modern high-rise sector. The elite residential sector is on the extension of the CBD in the "spine". The end of the spine of elite residency is the "mall" with high-priced residencies. |
|
|
Latin American Cities visual |

|
|
|
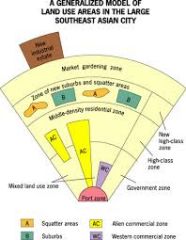
Southeast Asian Cities Model |
The Southeast Asian City Model is similar to the Latin American (Griffin-Ford) City Model in that they each feature high-class residential zones that stem from the center, middle-class residential zones that occur in inner-city areas, and low-income squatter settlements that occur in the periphery. The main difference between the two models is that the Southeast Asian City Model features middle-income housing in suburban areas. |
|
|
Southeast Asian Cities Model visual |
|
|
|
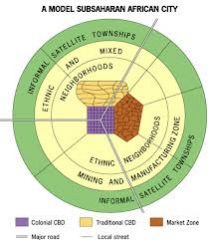
African Cities Model |
Vertical structure in colonial, one-story buildings in transitional, and informal stands for period market; Ethnic and mixed neighborhoods by mining and manufacturing zones; squatter settlements around the periphery. 3 types: colonial CBD, period market zone, and transitional business CBD. |
|
|
African Cities Model visual |
|