![]()
![]()
![]()
Use LEFT and RIGHT arrow keys to navigate between flashcards;
Use UP and DOWN arrow keys to flip the card;
H to show hint;
A reads text to speech;
46 Cards in this Set
- Front
- Back
|
Digitizing |
The process of taking coordinates from a map, image or other source and converting them to a digital format in a GIS. |
|
|
Digital map |
An electronic depiction of spatial data. |
|
|
Data Area or Pane |
Map component that contains most of the depicted spatial data. Usually the largest component. |
|
|
Neatline |
Included to provide a frame around all map elements. |
|
|
Map Scale |
The ratio of the distance on the map to corresponding distance on the ground. |
|
|
Graticule |
Maps in which coordinate lines represent constant latitude and longitude. |
|
|
What are the characteristics of a Graticule? |
Coordinate lines of latitude and longitude may appear curved depending on Map Scale, the map coordinate system, and the location of the area on the Earth's surface. |
|
|
Grid |
Map depiction of lines of constant coordinates. |
|
|
How are Graticules useful? |
Graticules are useful in depicting distortion in a map because they show how the geographic North or East lines are deformed and how this distortion varies across the map. |
|
|
How are Grids useful? |
Grids may establish a map-projected north, and may be useful when trying to navigate or locate a position on a map. |
|
|
Cartometric Map |
A faithful representation of the relative position of objects. Suitable source of spatial data. |
|
|
Feature Map |
Map of points, lines or areas. |
|
|
Choropleth Map |
Map depicting the quantitative information for areas. Each area is given a color, shading or pattern corresponding to values for a mapped variable. |
|
|
Dot Density Map |
Commonly used to show quantitative data, dots are placed in a polygon or area such that the number of dots equals the total value for that polygon. Dots are typically placed randomly within the polygon area. |
|
|
Isopleth or Contour Map |
Map representing continuous surfaces such as rainfall, elevation or temperature. |
|
|
When might lines on a contour map converge? |
Depictions of cliffs or overhangs in a contour map of elevation' may have lines that coincide when there is a common positional value. |
|
|
Map Generalization |
The approximation of real features when they are represented on a map due to the impossibility of collecting every geometric or attribute detail of the physical world. |
|
|
Feature Generalization |
The modification of features when representing them on a map. |
|
|
What are the different classes of Feature Generalization? |
Fused - multiple features may be grouped together to form a larger feature.
Simplified - boundary or shape details are lost or "rounded off".
Displaced - features may be offset to prevent overlap or to provide a standard distance between mapping symbols. Omitted - small features may be excluded. Exaggerated - standard symbol sizes may be larger when scaled to the true width of the feature. Exaggerated - standard symbol sizes may be larger when scaled to the true width of the feature.
|
|
|
When should an analyst or organization return to the field to collect data of greater precision? |
When map generalization results in omission or degradation beyond acceptable levels. |
|
|
Registration |
The conversion of digitizer or other coordinate data to an Earth surface coordinate system. |
|
|
Manual Digitization |
The human-guided coordinate capture from a map or image source. |
|
|
What are two common forms of manual digitization? |
On-screen and hardcopy. |
|
|
On-screen (heads-up) digitization |
Manual digitization occurs in a computer screen using a digital image as a backdrop. |
|
|
Hardcopy Digitization |
Human guided coordinate capture from a paper, plastic or other hardcopy map using an electrically sensitized pick to trace lines or points on a map that is secured to a digitizing surface. |
|
|
Point Mode in Digitizing |
The operator must depress a button or in some way signal to the co outer to sample each point. |
|
|
Stream Mode in Digitizing |
Points a automatically sampled at fixed time or distance frequency. |
|
|
Minimum Distance Digitizing |
A variant of stream mode digitizing where a new point is not recorded unless it is more than some minimum threshold distance from a previously sampled point. |
|
|
Undershoot |
Nodes that do not quite reach a line or another node, causing unconnected networks and included polygons. |
|
|
Overshoots |
May not cause problems in defining polygons but may cause problems when defining and analyzing line networks. |
|
|
Spline Functions |
A set of polynomial functions that join smoothly. Used to smoothly interpolate curves between digitized points. |
|
|
Scan Digitizing |
A scanner passes a sensing element over an illuminated map. The sensor measures the location of a point and the strength of light reflected from the point. These intensities are converted into numbers. |
|
|
Skeletonizing |
Reducing the widths of lines or points to a single pixel. Often required in scan digitization, especially when the data are to be converted into vector format. |
|
|
Coordinate Transformation or Registration |
Bringing spatial data into an Earth-based coordinate system to ensure that each data layer aligns with every other data layer. |
|
|
Control Points |
Used to transform digitized data from the digitizer coordinate system to a map-projected coordinate system. The locations of control points are known in the map projection coordinates and the digitizer coordinates. |
|
|
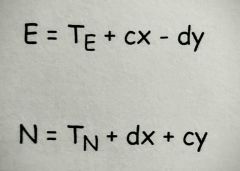
Affine Coordinate Transformation |

Employs linear equations to calculate map coordinates. |
|
|
RMSE |

Root Mean Square Error |
|
|
Conformal Transformation |
Similar to affine transformations. Also used a first order polynomial but required equal scale changes in the x and y directions. |
|
|
Resampling |
Reassigning cell values when changing raster coordinates or geometry. |
|
|
Nearest Neighbor Resampling |
Taking the output value from the nearest input layer cell center. |
|
|
Bilinear Interpolation |
Distance-based averaging of the four nearest cells. |
|
|
Cubic Convolution |
A weighted average of the 16 nearest cells. |
|
|
Map Transformation |
Typically employs a statistically-fit linear equation to convert coordinates from one Cartesian coordinate system to another. |
|
|
Map Projection |
An analytical, formula-based conversion between coordinate systems, usually from a curved, latitude/longitude coordinate system to a Cartesian coordinate system. No statistical fitting process is used with a map projection. |
|
|
SDTS |
Spatial Data Transfer Standard 1- a logical specification 2- a description of the types of features supported 3- the ISO encoding used |
|
|
Metadata (in GIS) |
Information about spatial data including content, source, lineage, developer, coordinate system, extent, structure, spatial accuracy, attributes, and responsible organization for spatial data. |