![]()
![]()
![]()
Use LEFT and RIGHT arrow keys to navigate between flashcards;
Use UP and DOWN arrow keys to flip the card;
H to show hint;
A reads text to speech;
15 Cards in this Set
- Front
- Back
|
Statistical Process control |
the application of statistical techniques to ensure that processes meet standards |
|
|
central tendency |
mean |
|
|
control charts |
constructed from historical data, helps distinguish the two types of variation |
|
|
control criteria
|
1.no sample points outside the limit 2.points are near the average 3. approx. at even # of points above and below 4. points appear to be randomly distributed around the center line |
|
|
variables |
measures dimensions such as weight, speed, height, or strength falls within an acceptable range use x bar and r chart measured |
|
|
attributes |
good or bad, acceptable or unacceptable does not address degree of failure P chart (percent defectives) or c chart (# of defects) counted |
|
|
xbar charts |
plot of mean of samples taken from a process |
|
|
r chart |
a plot of the range within each sample -difference between highest and lowest numbers |
|
|
sample size vs number of samples |
sample size = 9 boxes number of samples = 12 hrs |
|
|
set control limits |
1. find the mean of all the means 2. select z z=3 for 99.7% or 6 for 99.9997 3. control limit = x barbar +/- z(pop sd) |
|
|
x chart without sigma |
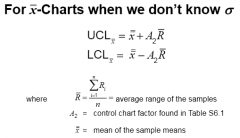
A2 will come from control chart |
|
|
r bar |
find highest sample - lowest sample for each sample and divide by number of samples |
|
|
chart limits for R charts |
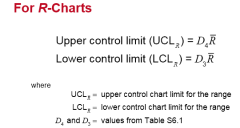
D4 and D3 from control chart |
|
|
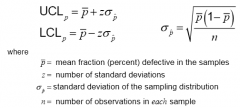
P chart limits |
|
|
|
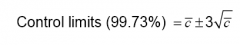
C chart limits |
|