![]()
![]()
![]()
Use LEFT and RIGHT arrow keys to navigate between flashcards;
Use UP and DOWN arrow keys to flip the card;
H to show hint;
A reads text to speech;
10 Cards in this Set
- Front
- Back
|
Australia |
Egalitarian society - considered as one of the less equal in industrialised world |
|
|
INCOME VS WEALTH |
Income: amount of money or benefits measured in monetary terms which flows to individuals or households usually for sale FOP or direct payment from the government Wealth: value of stock of assets held by individuals |
|
|
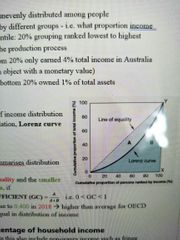
Lorenz Curve |
Graphical representation of income distribution showing cumulative increase in population against cumulative increase in income. If income distributed evenly the Lorenz curve is a straight line |
|
|
Gini coefficient |
Single statistic that summarises distribution of income across population. Higher GC = more inequality |
|
|
SOURCES OF INCOME |
- Wages from labour - Rent from land - Interest from capital - Profit from sale entrepreneurial skills - Social welfare |
|
|
Sources of wealth |
Household assets, business capital, consumer durables, gov. Bonds and securities, money base, overseas investment, equity investment |
|
|
TRENDS |
AGE - Younger people earn less per week than older people - Prime age and income received 25-40 - Income reduce 55 onwards GENDER - Female wage 65% of men ETHNIC BACKGROUND - Born overseas earn more income than Aus - Non English speaking background migrants earn less - ATSI FAMILY STRUCTURE - Couple no dependent children is the richest GEOGRAPHY - urban vs rural |
|
|
ECONOMIC IMPACTS |
BENEFITS - Encourage increase skills - Labour force encourage work harder increase productive capacity - Mobile labour force - Entrepreneurs accept more risk - Higher savings and capital formation COSTS - Reduce utility - Consumption and investment reduced - Expenditure conspicuous consumption - Less work and efficiency - Increase gov spending on welfare support |
|
|
Social impacts |
BENEFITS - Encourage hard work, risk taking, social mobility - Eco growth COSTS - Social class division - Intergenerational poverty cycle |
|
|
POLICIES REDUCE INCOME INEQUALITY |
Fiscal policy - tax free threshold increased 18200 - decrease rate of pension indexation Monetary - Expansionary stance MICRO - increase efficiency - Minimum wage increases - tax concessions to voluntary superannuation |