Reading...
![]()
Play button
![]()
Play button
![]()
Use LEFT and RIGHT arrow keys to navigate between flashcards;
Use UP and DOWN arrow keys to flip the card;
H to show hint;
A reads text to speech;
10 Cards in this Set
- Front
- Back
|
You work for a video streaming company that has two monthly plans to choose from. Plan 1 is a flat rate of $7 per month plus $2.50 per video viewed. Plan 2 is $4 per video viewed. What type of functions model this situation? Explain.
|
Each plan can be modeled by a linear function.
|
|
|
You work for a video streaming company that has two monthly plans to choose from. Plan 1 is a flat rate of $7 per month plus $2.50 per video viewed. Plan 2 is $4 per video viewed. Define variables that make sense in the context of the problem, and use them to write an equation with cost as a function of videos viewed, representing each monthly plan.
|
C₁= cost of plan 1
C₂= cost of plan 2 V= number of videos viewed C₁=7+2.5V C₂=4V |
|
|
You work for a video streaming company that has two monthly plans to choose from. Plan 1 is a flat rate of $7 per month plus $2.50 per video viewed. Plan 2 is $4 per video viewed. How much would 3 videos a month cost for each plan?
|
C₁=7+2.5V
C₁=7+2.5(3) C₁=$14.50 C₂=4V C₂=4(3) C₂=$12.00 |
|
|
You work for a video streaming company that has two monthly plans to choose from. Plan 1 is a flat rate of $7 per month plus $2.50 per video viewed. Plan 2 is $4 per video viewed. Compare the two plans and explain what advice you would give to a customer trying to decide which plan is best for them, based on their viewing habits.
|
Plan 1 costs less than plan 2 for 5 or fewer videos per month. A customer who watches more than 5 videos per month should choose plan 2. A customer who watches 5 or fewer videos per month should choose plan 1.
|
|
|
A student has had a collection of baseball cards for several years. B, the number of cards in his collection, can be described as a function of t, which is the time in years since the collection was started. Explain what this equation would tell us about the number of cards in his collection over time. B=200+100t
|
We can see that at t=0 (the start of his collection), he had 200 baseball cards. Since then, his collection has increased at a rate of 100 cards per year, meaning that the student added 100 cards to his collection each year.
|
|
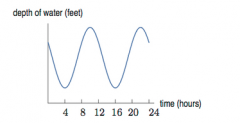
Based on this graph, how many high tides took place on this day?
|
There were two high tides on this day.
|
|

Based on this graph, how many low tides took place on this day?
|
There were two low tides on this day.
|
|

Based on this graph, how much time elapsed in between high tides?
|
There is about 12 hours between high tides.
|
|
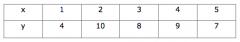
For the non-linear function shown in this table, describe the graph of the function between x=3 and x=4
|
Between x=3 and x=4, the graph is increasing at a slope of 1.
|
|
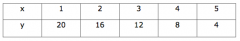
Describe the graph of the function shown in this table. Is it linear or nonlinear?
|
The graph is linear and decreasing.
|