![]()
![]()
![]()
Use LEFT and RIGHT arrow keys to navigate between flashcards;
Use UP and DOWN arrow keys to flip the card;
H to show hint;
A reads text to speech;
85 Cards in this Set
- Front
- Back
|
The objective of Inventory Management |
To strike a balance between inventory investment and customer service
|
|
|
Reasons Inventory Exists |
1. Separate the firm from fluctuations in demand 2. Decouple various parts of the production process 3. Take advantage of quantity discounts 4.Hedge against inflation or other possible future events |
|
|
Reason Inventory Exists #1 |
Separate the firm from fluctuations in demand |
|
|
Reason Inventory Exists #2 |
Decouple various parts of the production process |
|
|
Reason Inventory Exists #3 |
Take advantage of quantity discounts |
|
|
Reason Inventory Exists #4 |
Hedge against inflation or other possible future events |
|
|
When there is predictable variation in demand throughout the year, andwhen an organization does not have the capacity to produce peak demand when it isdemanded, the organization may have to produce (or acquire) and store finished productsin advance of that demand |
Seasonal Inventory |
|
|
When there isunpredictable (i.e. erratic and random) short term variation in demand, the organizationmay have to maintain additional inventory to cover the unpredictable spikes in demand |
Safety Stock |
|
|
If there is an interruption in output at one stage, succeedingstages may be able to continue operation by feeding off the inventory held betweenstages |
Buffering Inventory |
|
|
Purchases in large quantities may result inreduced purchase price and/or reduced delivery cost. Often leads organizations to acquire more inventory than is immediately needed. |
Volume Discount Inventory |
|
|
Whenorganizations may choose toorder more inventory than is immediately needed to provide protection in the event that situations of uncertainty, disaster, or interruption may occur. |
Hedge Inventory |
|
|
Materials that are usually purchased and have not yet enteredthe transformation process
|
Raw Materials Inventory |
|
|
Materials and components that have undergone somechange but have not yet advanced to the stage of completed product |
Work-In-Progress (WIP) Inventory |
|
|
Supplies necessary to keep machinery,processes, facilities, and office operations running. Not part of products being made, but are crucial to the smooth operation of the organization. ie Lubricating Oil, Custodial Products, Toner and Office Supplies |
Maintenance/Repair/Operating (MRO) Inventory |
|
|
Completed products awaiting shipment |
Finished-goods inventory |
|
|
Basic Inventory Decisions |
How Much? When? |
|
|
Determination of thequantity to be ordered |
How Much? Lot Sizing Decision |
|
|
Determination of thetiming for the orders |
When? Lot Timing Decision |
|
|
Inventory item whose demand is not related to (or dependent upon) some higher level item. Demand for such items is usually thought of asforecasted demand. These items are usually thought of as finishedproducts. |
Independent Demand Inventory Item |
|
|
Inventory item whose demand is related to (or dependent upon) some higher level item. Demand for such items is usually thought of as derived demand. These items are usually thought of as the materials, parts, components,and assemblies that make up the finished product. |
Dependent Demand Inventory Item |
|
|
Relevant Inventory Costs |
-Item Costs -Holding Costs -Ordering/Setup Costs -Shortage Costs |
|
|
Direct cost forgetting an item.Purchase cost foroutside orders,manufacturingcost for internalorders. |
Item Costs |
|
|
Costs associatedwith carryingitems in inventory.Storage and otherrelated costs. |
Holding Costs |
|
|
Fixed costsassociated withplacing an order. |
Ordering/Setup Costs |
|
|
Ordering Costs are for _____ orders |
Outside |
|
|
Setup Costs are for _____ orders |
Internal |
|
|
Costs associatedwith not havingenough inventoryto meet demand. |
Shortage Costs |
|
|
The time interval typically used for comparing costs |
One Year |
|
|
How the per unit item cost is measured depends upon... |
...whether the item is one that isobtained from an external source of supply, or is one that is manufactured internally |
|
|
For itemsthat are ordered from external sources, the per unit item cost is... |
...predominantly the purchase pricepaid for the item. On some occasions this cost may also include some additional charges, likeinbound transportation cost, duties, or insurance. |
|
|
For items that are obtained from internalsources, the per unit item cost is composed of... |
...the labor and material costs that went into itsproduction, and any factory overhead that might be allocated to the item. In many instances theitem cost is a constant, and is not affected by the lot sizing decision. In those cases, the totalannual item cost will be unaffected by the order size |
|
|
Regardless of the order size (which impactshow many times we choose to order that item over the course of the year)... |
...our total annualacquisitions will equal the total annual need. Acquiring that total number of units at the constantcost per unit will yield the same total annual cost |
|
|
Graph of Item Costs Lot Size (x) versus Cost (y) In regards to Total Annual Item Cost (assuming no quantity discounts) |
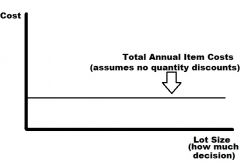
Straight Horizontal Line |
|
|
Other, more subtle expenses that add to Holding Cost |
Insurance on the held inventory; taxes on the held inventory; damage to, theft of, deterioration of,or obsolescence of the held items, and opportunity costs associated with having money tied up ininventory. |
|
|
Graph of Holding Costs Lot Size (how much decision) (X) versus Cost (Y) In regards to Total Annual Holding Cost |
Straight, constant upward slope (make graph) |
|
|
Graph of Ordering (or Setup) Costs |
Make Graph |
|
|
Shortage costs can manifest themselves in the form of... |
...lost sales, lossof good will, customer irritation, backorder and expediting charges, etc. |
|
|
Large order sizes will lead to... |
...lower annual shortage costs |
|
|
Graph of Shortage Costs |
Make Graph |
|
|
All Four Cost Categories Combined Graph |
CP3 Page 11 |
|
|
A technique for determining the best answers to the how much and whenquestions. It is based on the premise that there is an optimal order size that will yield the lowestpossible value of the total inventory cost. |
EOQ Model |
|
|
EOQ Assumption 1 |
Demand for the item is known and constant |
|
|
EOQ Assumption 2 |
Lead time is known and constant. (Lead time is the amount of time that elapses betweenwhen the order is placed and when it is received.) |
|
|
EOQ Assumption 3 |
When an order is received, all the items ordered arrive at once (instantaneousreplenishment) |
|
|
EOQ Assumption 4 |
The cost of all units ordered is the same, regardless of the quantity ordered (no quantitydiscounts) |
|
|
EOQ Assumption 5 |
Ordering costs are known and constant (the cost to place an order is always the same,regardless of the quantity ordered). |
|
|
EOQ Assumption 6 |
Since there is certainty with respect to the demand rate and the lead time, orders can betimed to arrive just when we would have run out. Consequently the model assumes thatthere will be no shortages. |
|
|
The only two costs that will vary with changes in the orderquantity EOQ Assumptions |
(1) the total annual ordering cost and (2) the total annual holding cost. Shortage costcan be ignored because of assumption 6. |
|
|
Since the cost per unit of all items orderedis the same... |
...the total annual item cost will be a constant and will not be affected by the orderquantity. |
|
|
Inventory Levels Graph |
CP3 Page 12 |
|
|
EOQ stands for... |
Economic Order Quantity |
|
|
Total Annual Ordering Cost equation |
(D/Q)S D= Annual Demand Q= Size of Order S= Cost of Placing an Order |
|
|
Total Annual Holding Cost equation |
(Q/2)H Q= Size of Order (Maximum Value) H= Cost to Carry a Unit in Inventory for a Year |
|
|
Total Annual Cost equation |
TC= (D/Q)S + (Q/2)H Annual Ordering Cost + Annual Holding Cost |
|
|
EOQ, optimal value of the order quantity (Q) equation |
Q* = sqrt(2DS/H) (Q* represents the optimal value for Q; this is what we call the EOQ) |
|
|
EOQ Graph |
CP3 Page 14 |
|
|
ReOrder Point (ROP) |
Daily Demand * Lead Time |
|
|
When replenishment items come from insidesources, the entire batch is usually not received all at once (instantaneous replenishment), butinstead is gradually received as a production batch is run (continuous replenishment). |
Economic Production Quantity (EPQ) Model |
|
|
When the supplier is willing to offer a lower price if large quantitiesof an item are ordered, the total annual purchase cost line will no longer be horizontal, but willinstead have step decreases in it. |
Quantity Discount Model
|
|
|
When therewill be demand for an item in only one period, so the challenge is to determine the order size(stock size) that will best accommodate the anticipated (and uncertain) demand. Any itemsstocked in excess of demand will be scrapped. Any demand in excess of what has been stockedwill be a missed opportunity for more profit. |
Single-Period Inventory Model |
|
|
This approach maintains a constant order size, but allows thetime between the placement of orders to vary |
Fixed Quantity or Q System |
|
|
Fixed Quantity or Q System is sometimes referred to as... |
Perpetual review method, a continuous review system, a reorder point system,and a two-bin system
|
|
|
Fixed Quantity or Q System Graph |
CP3 Page 23 |
|
|
This approach maintains a constant time between the placement oforders, but allows the order size to vary. |
Fixed Period System or Fixed Interval System |
|
|
Fixed Period System |
CP3 Page 24 |
|
|
This approach allows both the order size and the time between the placementof orders to vary |
Hybrid System or Optional Replenishment System or Min-Max System |
|
|
Hybrid System Graph |
CP3 Page 25 |
|
|
Fixed Quantity Advantages |
-provides tighter control overinventory items -less safety stock needed |
|
|
Fixed Quantity Disadvantages |
-requires constant monitoring(constant scrutiny) -problems with multiple itemsfrom same source (many itemsarrive in separate shipments) |
|
|
Fixed Period Advantages |
-joint shipping advantage withmultiple items from same source
-does not require constantmonitoring |
|
|
Fixed Period Disadvantages |
-requires more safety stock -occasional small “nuisance”orders may result -provides looser control overinventory items |
|
|
Hybrid System Advantages |
-joint shipping advantage withmultiple items from same source -does not require constantmonitoring -no small “nuisance” orders |
|
|
Hybrid System Disadvantages |
-requires more safety stock -provides looser control overinventory items |
|
|
Category A Inventory Items (ABC) |
Need the tightest degree of control |
|
|
Category B Inventory Items (ABC) |
Medium degree of control |
|
|
Category C Inventory Items (ABC) |
Do not need very close scrutiny |
|
|
ABC Explained |
Start at CP3 Page 28 |
|
|
Generates a set of time phased requirements for each of theitems in the product structure, and then make the timing and sizing decisions to accommodatethose time phased requirements |
Material Requirements Planning (MRP) |
|
|
Parts that go into Material Requirements Planning (MRP) |
-Master Production Schedule (MPS) -Inventory Records File (IRV) -Planned Order Releases (POR) -Bill of Materials (BOM) |
|
|
Statement of the gross requirements for the finished product (anticipated need schedule for the finished product).
|
Master Production Schedule |
|
|
Product structure information, showing exactly what components are needed to produce a finished product, and how they are assembled together (the hierarchical product structure information).
|
Bill of Materials |
|
|
Information regarding the available on hand inventory and on order inventory for each item in the bill of materials
|
Inventory Records File |
|
|
These are the answers to the how much and when questions for each inventory item in the product structure. They are time phased statements about planned orders. |
Planned Order Releases |
|
|
Reflects the total need for an inventory item to support demand (either demand for a finished product, or demand for some higher level item in the product structure) |
Gross Requirements |
|
|
Reflects the production need for an inventory item to support demand. These are generally found by taking the gross requirements (total need) and subtracting any available inventory (either on hand or on order). This is what we actually have to produce.
|
Net Requirements |