![]()
![]()
![]()
Use LEFT and RIGHT arrow keys to navigate between flashcards;
Use UP and DOWN arrow keys to flip the card;
H to show hint;
A reads text to speech;
10 Cards in this Set
- Front
- Back
|
Absolute Poverty |
A situation where indivduals cannot afford the basic necessities for a healthy & safe existence e.g shelter, water, nutrition, clothing & healthcare |
|
|
Relative Poverty |
A situation where household income is a certain percentage less than the median household income in an economy. |
|
|
Causes of changes in Absolute Poverty |
Economic growth, government tax & benefit policies. |
|
|
Causes of changes in Relative Poverty |
Rising asset prices, Trade liberalisation (removing barriers to international trade e.g tariffs), Government Benefits |
|
|
Income Inequality |
Refers to the unequal distribution of income to households e.g rent, wages |
|
|
Wealth Inequality |
Refers to the differences in the amount of assets that households own. |
|
|
The Lorenz Curve |
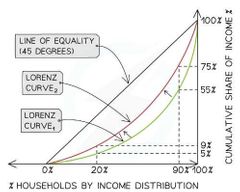
A visual representation of the inequality that exists between households in an economy, the line of equality represents perfect income distribution (not desirable). |
|
|
The Gini Coefficient |
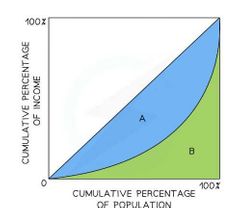
Measures the distribution of income in a population, the closer the value to 1 the worse the income inequality. Gini Coefficient = A/ (A+B) |
|
|
Causes of Income & Wealth Inequality |
Education, Training & Skills, Trade Unions, Benefit System, Pension Payments. |
|
|
Graph relating Economic Development to Income Inequality |
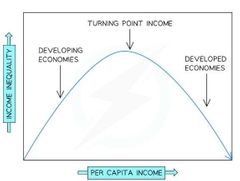
|