![]()
![]()
![]()
Use LEFT and RIGHT arrow keys to navigate between flashcards;
Use UP and DOWN arrow keys to flip the card;
H to show hint;
A reads text to speech;
46 Cards in this Set
- Front
- Back
|
Increasing performance in a six sigma project from 3 sigma to 4 sigma would reduce DPMO by a factor of: |
10 DPMO for a sigma level of 3.00 is 66,807 DPMO for a sigma level of 4.00 is 6,209 Divide the two and you get 10.75. |
|
|
In highly effective six sigma companies, most employees receive some training. What group is most likely to receive sponsorship training? |
Senior management |
|
|
Specification limits are derived from which of the following: -process capability studies -process control charts -customer requirements -historical data |
Customer requirements |
|
|
The primary purpose of a control chart is to: |
Determine the stability of a process |
|
|
The overall ability of two or more operators to obtain consistent results repeatedly when measuring the same set of parts and using the same measuring equipment is the definition of: |
Reproducibility |
|
|
Which condition must be met for a process to be in a state of statistical control? |
All subgroup averages ad ranges are within control limits |
|
|
Whast is the most useful graphical tool for promoting an understanding of process capability? |
A histogram |
|
|
The fraction of nonconforming products is plotted on what type of control chart? |
p chart |
|
|
A GB is going to monitor the number of defects on different size samples. What type of control chart would be most appropriate? |
u chart |
|
|
Which tools are appropriate for a quality engineer to use in qualifying a process that has variable data? |
An x-bar chart, R control chart, and a histogram chart. |
|
|
Which case would be the most desirable in terms of the relationship of the specification to the process spread? |
6(std) < USL - LSL |
|
|
What measure is increased when process performance is increased? |
Sigma level |
|
|
What is a Type I error? |
Occurs when looking for a special cause of variation when in reality, a common cause is present. |
|
|
John set the control limits to be at +/- 2.5 standard deviations for his control chart. Mary set the control limits to be at +/- 3.0. Which one's control chart has a higher probability for Type I errors? |
John |
|
|
What is a key objective of a six sigma project? |
Reducing variation in critical processes |
|
|
Calculate the F test for Operators |
MS operators/ MS Repeatability |
|
|
% Contribution is additive or more complicated? |
Additive |
|
|
% Study Var is additive or more complicated? |
More complicated. It is the square root of the respective % contribution times 100. |
|
|
Calculate sigma level empirically |
Find DPO by counting the number of defects divdied by the number of opportunities. Get the DPMO and use the table to find sigma level. OR do invNorm(DPO) in your calculator to find exact sigma level. |
|
|
Calculate sigma level theoretically |
Take the absoulte value of the lower specification minus the mean, divided by the standard deviation. |
|
|
Determining the long term sigma level |
If the process can be maintained, add 1.5. If the process cannot be maintains, subtract 1.5. |
|
|
Estimate the process standard deviation |
MR-bar/d2
|
|
|
The long term sigma levels are 3.8 for process A, 3.1 for process B, and 3.5 for process C. What is the long term sigma level for the whole process? |
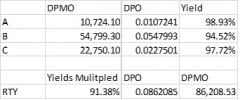
You plug in the DPMO into the table and you will get a long-term sigma level of 2.86 |
|
|
Kano cost distribution for a CTQ |
=MAX[(O+M+A),(I+Q+R)] |
|
|
Define Process |
a collection of interacting components that transform inputs into outputs toward a mission statement. It is the job of management to optimize the entire process toward its aim. This may require the sub-optimization of selected components of the process. |
|
|
What are the types of the variation? |
Common and special |
|
|
Goalpost view of quality |
This says that any item with the measurement of the CTQ falls inside the specification limits, it has all the same quality. There is not loss as long as the measurement of CTQ falls inside the specification limits. Once it is outside, it suffers a TOTAL loss. |
|
|
Continuous improvement of quality |
This says that as a long as the measurement of the CTQ is away from the target, there is a loss. The farther away from the target, the higher the loss is. Once it is outside the specification limits, it suffers from the total loss. |
|
|
Relationship between VoP and VoC |
Six Sigma promotes the idea that the distribution of output for a stable normally distributed process (VoP) should be desgined to take-up no more than hald of the tolerance allowed by the specification limits (VoC) |
|
|
What is a CTQ? |
Critical to Quality. A measure of what is important to a customer. |
|
|
SDSA Model |
Standardize-Do-Study-Act |
|
|
PDSA Model
|
Plan-Do-Study-Act |
|
|
SMART |
Specific, Measurable, Attainable, Relevant, Time Bound |
|
|
SIPOC analysis |
Tool for identifiying the Suppliers and their Inputs into a process, the high level of steps of a Process, the Outputs of the process, and the Customer segments interested in the outputs. |
|
|
Part-to-part variation |
variability created by meaurement of multiple parts under identical conditions |
|
|
Reproducibility |
variation due to operators |
|
|
Variation due to gages |
variability created by repeatability (multiple measurements of same unit under identical conditions), calibration (adjustment of a measurement instrument to eliminate bias), stability (is a change in the accuracy, repearability, or reproducibility of a masurement system), linearity (is the different between the part reference value and the part average over the different values of the domain of the gage) |
|
|
Percent R&R |
percentage of the process variation due to the repeatability and reproducibility of the measurement system |
|
|
Percent tolerance |
percentage of the part tolerance due to the repeatability and reproducibility of the measurement system |
|
|
Resolution |
fineness of the measurement system |
|
|
Calculate capability |
A meaurement system is acceptable if the standard deviation is < tolerance*(1/10) |
|
|
Calculate Bias |
What the measurement is suppose to be - the average of our collected measurements |
|
|
Process standard deviation using range method |
standard deviation = R-bar/d2 |
|
|
UCL and LCL using range method |
X-bar +/- 3(standard deviation/ sqrt(n)) |
|
|
Process std using std method |
std = S-bar/c4 |
|
|
UCL and LCL using std method |
X-bar +/- 3(std/sqrt(n)) |