![]()
![]()
![]()
Use LEFT and RIGHT arrow keys to navigate between flashcards;
Use UP and DOWN arrow keys to flip the card;
H to show hint;
A reads text to speech;
100 Cards in this Set
- Front
- Back
|
a business process is... |
any activity or group of activities that takes an input, adds value to it, and provides an output to an internal or external customer
processes use an organization's resources to provide definitive results |
|
|
What are keys to managing from afar as it applies to business processes? |
the larger the customer base for a company the more important the standardized processes that make up its operations
ex: mcdonalds, dell, walmart |
|
|
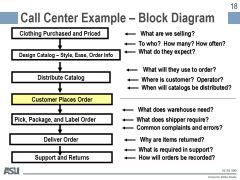
Block Diagram |
|
|
|
scope inflation is... |
the smarter you are the more likely you are to fall into scope inflation
focus on a small narrow scope otherwise it will get too big and overwhelming |
|
|
Rectangle |
Task, operation, data collection |
|
|
Diamond |
decision point where multiple flow paths possible |
|

|
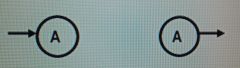
Terminator: depicts start/end or entrances/exits to process |
|
|
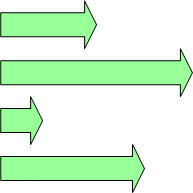
Arrow |
depicts flow of customer/material within the process |
|
|
Rectangle inside rectangle |
Process: depicts an entire process; Likely depicted in another flowchart |
|
|
Movement, Transportation
ex: delivering furniture to customer |
|

|
Inspection requirement
ex: employee compares order ticket to items in customers bag |
|

|
Delay in process
ex: wait for approval |
|
|
connector: output leads to another flow chart or into another flowchart |
|
|
process analysis is... |
the documentation and detailed understanding of how work is performed and how it can be redesigned |
|
|
process analysis steps |
|
|
|
identify opportunities (process analysis steps) |
first step; look for gaps or better ways of doing things to improve the process |
|
|
define the scope (process analysis steps) |
2nd step; establishes the boundaries of the process to be analyzed; a process's scope can be too broad or narrow |
|
|
a design team... |
consists of knowledgeable, team-oriented individuals who work at one or more steps in the process, conduct the process analysis, and make the necessary changes; mainly for broad scope, major core processes |
|
|
document the process (process analysis steps) |
step 3; includes making a list of the process's inputs, suppliers (internal or external), outputs, and customers (internal or external); this info can then be shown as a diagram with a more detailed breakdown given in a table |
|
|
evaluate performance (process analysis steps) |
step 4; analyst creates multiple measure of quality, customer satisfaction, time to perform each step or the whole process, cost, errors, safety, environmental measure, on-time delivery, and flexibility |
|
|
redesign the process (process analysis steps) |
step 5; analysis team creates list of ideas for improvement>justifiable ideas put into new design; gives clear before and after pictures; shows how revised process will benefit using established metrics |
|
|
implement changes (process analysis steps) |
widespread participation in process analysis is essential bc it builds commitment from everyone |
|
|
5 techniques for documenting and evaluating processes |
|
|
|
a flowchart is... |
a diagram that traces the flow of info, customers, equipment, or materials through the various steps of a process |
|
|
cow path theory is... |
New cow is expected to follow path of old cow even though new cow sees faster and more effective way to reach water. |
|
|
swim lane flowcharts are... |
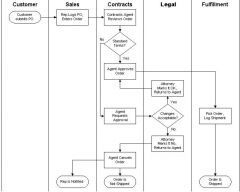
a visual representation that groups functional areas responsible for different sub-processes into lanes. It is most appropriate when the business process spans several department boundaries. |
|
|
service blueprints are... |
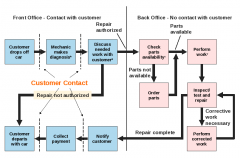
a special flowchart of a service process that shows which steps have high customer contact |
|
|
4 work measure techniques |
|
|
|
time study method (4 work measure techniques) |
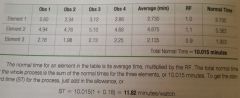
a work measurement method using a trained analyst to perform 4 basic steps in setting a time standard for a job or process: selecting the work elements (or nested processes) within the process to be studied, timing the elements, determining the sample size, and setting the final standard |
|
|
elemental standard data approach (4 work measure techniques) |
a database of standards compiled by a firm's analysts for basic elements that they can draw on later to estimate the time required for a particular job, which is most appropriate when products or services are highly customized, job processes prevail, and process divergence is great |
|
|
predetermined data approach (4 work measure techniques) |
a database approach that divides each work element into a series of micromotions that make up the element. The analyst then consults a published database that contains the normal times for the full array of possible micromotions |
|
|
work sampling method (4 work measure techniques)
|
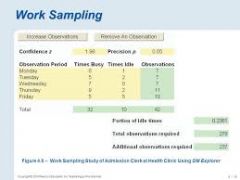
a process that estimates the proportion of time spent by people or machines on different activities, based on observations randomized over time.
best when processes are highly divergent with flexible flows |
|
|
learning curve analysis |
takes into account that learning takes place on an ongoing basis, such as when new products or services are introduced frequently |
|
|
a learning curve is... |
a line that displays the relationship between processing time and the cumulative quantity of a product or service produced. |
|
|
a process chart is... |
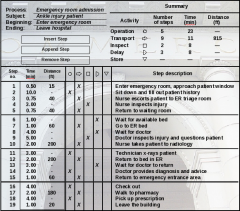
an organized way of documenting all the activities performed by a person or group of people, at a workstation, with a customer, or on materials. |
|
|
performance measurement |
|
|
|
Performance metric |
|
|
|
system of metrics |
|
|
|
reasons organizations utilize performance metrics |
|
|
|
consequences of poor metrics |
|
|
|
requirements of a good metric |
|
|
|
SMART metrics |
specific, measureable, attainable, relevant, and timely |
|
|
3 key measurement system attributes |
|
|
|
keys to designing a system of metrics |
|
|
|
KPIs |
key performance indicators
|
|
|
executive dashboards |
|
|
|
managerial paralysis |
a situation where managers are flooded with data which slows decision-making and may result in managers stalling or avoiding decision-making |
|
|
common measurement pitfalls in business |
|
|
|
shared metrics |
|
|
|
BSC |
|
|
|
BSC explained |
BSC is used to proactively look for problems before they impact the financial results
ex: catching customer-related issues earlier than a traditional system that only tracks financial results |
|
|
SCOR model
|
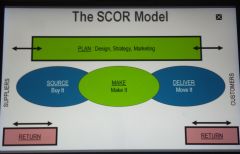
Supply Chain Operations Reference Model
a measurement tool to track performance, communicate progress, and develop opportunities for improvement connects SC activities from suppliers all the way to customers 5 primary SC processes are:plan source - purchasing process make - manufacturing process deliver - logistics and transportation return - reverse logistics |
|
|
total SCM costs |
the cost of every process, material, fee, defect, etc. that runs through the SC
also explained as the cost to plan, source, and deliver products/services
*relationship between 3 of the 5 in the SCOR model |
|
|
Cash-to-cash cycle |
|
|
|
capacity utilization |
|
|
|
process velocity |
|
|
|
perfect order fulfillment |
|
|
|
quality is... |
|
|
|
dimensions of quality (product) |
|
|
|
dimensions of quality (service) |
|
|
|
costs of quality |
|
|
|
internal failure costs (costs of quality) |
|
|
|
external failure costs (costs of quality) |
|
|
|
appraisal costs (costs of quality) |
|
|
|
prevention costs (costs of quality) |
|
|
|
quality gurus |
|
|
|
Deming (quality guru) |
|
|
|
Juran (quality guru) |
|
|
|
Crosby (quality guru) |
|
|
|
Other gurus |
|
|
|
calculating reliability |
|
|
|
Total backup reliability formula example
|
1 - (1-.89) ^ 3 = .9986
reliability - .96 * .9986 * .98 * .98 = 92.1% |
|
|
TQM |
|
|
|
customer focus (TQM) |
|
|
|
involvement (TQM) |
|
|
|
continuous improvement (TQM) |
|
|
|
benchmarking |
|
|
|
other types of benchmarking |
|
|
|
six sigma |
|
|
|
DMAIC (Six Sigma) |
|
|
|
quality certifications and awards |
|
|
|
ISO 9000 (quality certifications and awards) |
|
|
|
The Malcolm Baldrige National Quality Award |
|
|
|
Deming Prize (quality certifications and awards) |
a Japanese quality award given to companies or individuals that have contributed to the field of quality |
|
|
cause and effect diagrams (fishbone charts) |
|
|
|
scatter diagrams |
|
|
|
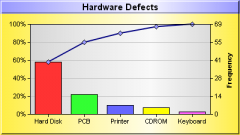
pareto charts |
|
|
|
histograms |
|
|
|
control chart |
|
|
|
CRM |
planning and control activities and info systems that link a firm with its downstream customers |
|
|
SRM |
planning and control activities ant info systems that link a firm with its upstream suppliers |
|
|
Internal supply chain management |
the information flows between higher and lower levels of planning and control systems within an organization |
|
|
ERP systems |
enterprise resource planning systems - large, integrated, computer-based business transaction processing and reporting systems. ERP systems pull together all of the classic business functions such as accounting, finance, sales, and operations into a single, tightly integrated package that uses a common database |
|
|
DSS |
decision support systems - computer-based information systems that allow users to analyze, manipulate, and present data in a manner that aids higher-level decision making |
|
|
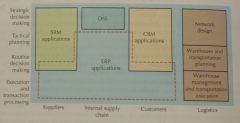
map of supply chain management information systems |
|
|
|
network design applications |
logistics info systems that address such long-term strategic questions as facility location and sizing, as well as transportation networks. These applications often make use of simulation and optimization modeling. |
|
|
cloud computing |
5 essential characteristics:
|
|
|
visibility |
|
|
|
mirroring |
|
|
|
creation of new customer relationships |
|