Reading...
![]()
Play button
![]()
Play button
![]()
Use LEFT and RIGHT arrow keys to navigate between flashcards;
Use UP and DOWN arrow keys to flip the card;
H to show hint;
A reads text to speech;
160 Cards in this Set
- Front
- Back
|
Core Functions of Public Health
|
Assessment: To regularly and systematically collect,
assemble, analyze, and make available information on the health of the community, including statistics on health status, community health needs, and epidemiologic and other studies of health problems Policy Development: To serve the public interest in the development of comprehensive public health policies by promoting the use of the scientific knowledge base in decision-making about public health and by leading in the developing public health policy Assurance: To assure their constituents that services necessary to achieve agreed upon goals are provided, either by encouraging actions by other entities (private or public), by requiring such action through regulation, or by providing services directly |
|
|
Primary Prevention
|
Strategies, tactics, and procedures
that prevent the occurrence of disease in the first place Examples: safe drinking water, vaccinations |
|
|
Secondary Prevention
|
Strategies, tactics, and procedures,
including screening tests, that detect disease as early as possible so that its progress can be arrested and, if possible, the disease eradicated Examples: Pap test for cervical cancer, HIV test |
|
|
Tertiary Prevention
|
Strategies, tactics, and procedures,
including interventions, that aim to arrest the progress of established disease Examples: chemotherapy for colorectal cancer, stroke rehabilitation program |
|
|
Defining a Population
|
Person (Who is getting the disease?)
e.g., age, sex, race/ethnicity, job, SES Place (Where is it occurring?) e.g., geopolitical (country, state), natural geographic features, environment (physical, biologic, social) Time (How is it changing over time? e.g., calendar year, time in the life course, can range from hours to decades |
|
|
Those who are not at risk include…
|
– people who currently have the disease
– people who lack the organ defining the disease – people who are immune to the disease |
|
|
Dynamic (i.e., open) population
|
– membership is based on a condition and is transitory
– e.g., Population of the US in 2012 Dynamic population: You usually assume “steady state” conditions apply for short intervals; the number leaving are balanced by the number entering, e.g., use midpoint estimate |
|
|
Fixed (i.e., closed) population
|
– membership based on an event and is permanent
– e.g. Persons living in Chernobyl on April 25, 1986; persons on a cruise ship during an outbreak of norovirus You take account of “persontime” (e.g., person-years) under observation In studies of closed (i.e., fixed) populations, it is often important to know not only who was at risk, but also how long each person was at risk. |
|
|
Seasonal Variation
|
Many disease cycles occur annually and represent
seasonal variation in disease occurrence Seasonal variation is a well-known characteristic for many infectious diseases and is usually based on… - characteristics of the infectious agent itself, - the life pattern of the vector or other animal hosts, and/or - changes in the likelihood of person-to-person spread. |
|
|
Endemic
|
The constant presence of a disease within a
given geographical area or population group May also refer to the usual prevalence of a given disease within such an area or group |
|
|
Epidemic
|
The occurrence in a community or region of
cases of an illness, specific health-related behavior, or other health-related events clearly in excess of normal expectancy Relative to usual frequency of the disease |
|
|
Pandemic
|
An epidemic occurring worldwide, or
over a very wide area, crossing international boundaries, and usually affecting a large number of people |
|
|
Demographic Equation
|
Natural change in population size =
Births - Deaths ± Migration |
|
|
Ages in the Epidemiologic Transition
|
The Age of Pestilence and Famine:
Mortality is high and fluctuating, low and variable life expectancy (range 20-40 years) The Age of Receding Pandemics: Mortality declines with fewer epidemics, life expectancy increases (from 30 to 50 years), population growth is sustained and begins to be exponential The Age of Degenerative and Man-Made Diseases: Mortality continues to decline and approaches stability at low level, chronic diseases replace infectious diseases as the primary causes of death |
|
|
Types of Calculations to Measure
Morbidity & Mortality |
Rate:
How fast is disease occurring? Events (e.g., cases)/ Population-Time Proportion: What fraction of the population is affected by disease? Number Affected/ Total Population Ratio: How do two quantities compare? Estimate in Ratio population #1: Estimate in population #2 Note: Ratios are unitless (when the two estimates are in the same units) |
|
|
Incidence
|
The number of new cases of a disease that occur
during a specified period of time in a population at risk for developing the disease Incidence = Number of NEW cases of a disease occurring in the population during a specified period of time / Number of persons who are AT RISK of developing the disease during that same period of time |
|
|
Cumulative Incidence
|
Cumulative Incidence (%) =
Number of new cases of a disease occurring in the population during a specified period of time / Number of persons at risk for the disease at the beginning of the period Note: All individuals are observed for entire period |
|
|
Incidence Rate
|
Incidence expressed as a rate in units of
person-time “at risk” Note: Some individuals are not observed for entire period (i.e., different people are observed for different lengths of time) # new cases/Person-time at risk example: 5/11.67 person-yr = 42.8 per 100 person- |
|
|
Prevalence
|
The proportion (%) of the population affected by
the disease at a given time (i.e., point in time or period in time); not a measure of risk Prevalence= (Number of existing cases of disease present in the population at a specified time/ Number of persons in the population at that specified time) x 100 Range for prevalence: [0,1] or [0%, 100%] Prevalence = Incidence x Duration If there is a steady-state situation (i.e., rates are not changing and in-migration equals out-migration) |
|
|
Annual All-cause Mortality Rate
(per 1,000 population) |
(Total number of deaths from all causes in 1 year/
Number of persons in the population at mid-year) x1,000 |
|
|
Cause-specific Mortality Rate
(per 1,000 population) |
Annual Mortality rate from “Disease A” per 1,000 population = Number of deaths from “Disease A” in 1 year / Number of persons in the population at mid-year) x 1,000
|
|
|
Proportionate Mortality
|
What proportion of all deaths in a given
year are due to a particular disease? # deaths due to particular disease/ Total # deaths Sometimes this is (incorrectly) called the Proportionate Mortality Rate. |
|
|
Case-Fatality Rate (CFR) (%)
|
# deaths from Disease Y/ # people with Disease Y
Note: Although usually called a “rate”, the CFR is really a proportion. CFR is a measure of the severity of a disease. |
|
|
When is a mortality rate a good index
of an incidence rate? |
When case-fatality rate is high (e.g., untreated rabies)
When the duration of the disease (i.e., survival) is short (e.g., pancreatic cancer) |
|
|
Two methods of adjustment
|
Direct - weighted average of specific rates
• Uses rates of sub-groups of populations being compared • Need to know sub-group distributions of events in both populations Indirect - compares observed number of events to expected number -->Used when sub-group distribution of events in population of interest is not known |
|
|
Direct age-adjustment
Steps |
• Step 1 – Calculate rates for each population
overall and by age category – Divide the number of events by the population • Step 2 - Identify the standard population – Most often, add populations of interest by age categories – Can select appropriate population with age categories (e.g., 2010 US population) • Step 3 – Apply all rates to standard population by age category to obtain expected number of events for each population • Step 4 – Sum the expected number of events for each population • Step 5 – For each population, divide the sum of expected number of events by the total standard population to obtain the age-adjusted rate |
|
|
Indirect age-adjustment Steps
|
Step 1 – Identify total observed events in
population of interest • Step 2 – Identify age-specific event rates for known population of comparison • Step 3 – Apply age-specific event rates (from comparison population) to age-specific strata of population of interest to obtain expected number of deaths for each age category • Step 4 – Sum the expected number of events for the population of interest • Step 5 – Divide the number of observed events by the number of expected events to obtain the standardized mortality ratio (SMR) |
|
|
Standardized mortality ratio
(SMR) |
Observed number of deaths/ Expected number of deaths
Note: Multiplication by 100 is often done to yield results without decimals |
|
|
Measures of Prognosis
|
5-year survival rate:
Proportion of persons in a specified group alive at the beginning of the 5 years who survive to the end of the 5 years Observed survival rates – person-time – life tables – Kaplan-Meier method Median survival time: Length of time that half of the study population survives Relative survival rate: Observed Survival Rate/Expected Survival Rate |
|
|
Life Tables
|
Two Assumptions Made In Using Life Tables:
1)No changes have occurred in survivorship over calendar time. 2)Those lost to follow-up experience the same survivorship as those who are followed. |
|
|
Kaplan-Meier Method
|
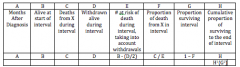
Requires date last observed or date outcome occurred on each individual (end of study can be the last date observed) The essence of the Kaplan-Meier (KM) method is having the date each outcome in the cohort occurred.
CALCULATING SURVIVAL USING THE KAPLAN-MEIER METHOD Columns: (1)Times to deaths from starting treatment (months) (2) Number alive at each time (3) Number who died at each time (4) Proportion who died at that time Column(3)/ Column(2) (5) Proportion who survived at that time 1-Column(4) (6) Cumulative proportion who survived to that time (Cumulative Survival) |
|
|
Median Survival Time
|
Length of time that half of the study
population survives Why median rather than mean? – Less affected by extreme values – Only need to observe deaths of half of the study group rather than the entire group |
|
|
Relative Survival Rate
|
Observed Survival Rate/
Expected Survival Rate |
|
|
Investigating an Outbreak
|
0. Determine existence of epidemic
1. Case definition 2. Identify cases and population at risk 3. Obtain information on time, place, and person 4. Collect specimens for lab analysis 5. Analyze data 6. Develop, test, and refine hypotheses 7. Implement control measures 8. Prepare report and disseminate findings |
|
|
Analyzing Data
in Outbreak Investigations |
1. Determine whether the observed number
of cases clearly exceeds the expected number 2. Calculate attack rates – Rate defined as the cumulative incidence of infection in a group observed during an epidemic – Note, time is implicit 3. Epidemic curve - A graph of the frequency of occurrence of cases by time of onset Patterns: Point source epidemic Common source epidemic Propagated epidemic 4. Spot map - A detailed map identifying the location of cases in a discrete area |
|
|
Attack Rate
|
Number of people at risk in whom a certain illness develops / Total number of people at risk
• AKA cumulative incidence • Can be designated for a given exposure, e.g., food-specific • Time is implicit |
|
|
Point Source Outbreaks
|
Population is exposed briefly /
simultaneously / at a single point in time Cases occur suddenly, and, after a brief peak period of time, fall off in a logarithmic fashion One incubation period |
|
|
Common Source Outbreak
|
Exposure is not brief / simultaneous, rather it
occurs over time Cases arise suddenly and continue to arise as more individuals continue to be exposed to the source Peaks in epidemic curve may represent two or more incubation periods |
|
|
Propagated Outbreak
|
Exposure can be brief or over time
Person-to-person transmission of disease Two or more peaks in epidemic curve as secondary cases occur from person-toperson spread Determinants of Propagated Outbreaks: Balance between proportion of susceptible and immune individuals in the population -Immunity may be: Innate (genetic) or Acquired (previous illness, immunization) Effective contact between agent and susceptible host Virulence of the organism |
|
|
Herd Immunity
|
The relative resistance of a group to an
outbreak of a disease when a critical proportion, but not all, of the group is immune. This occurs when the disease is spread by person-to-person contact. The greater the proportion of immune people in the group, the less likely it is that an infected person will encounter a susceptible person. If such encounters are sufficiently rare, the disease will not propagate in the group. The critical proportion of immune people varies with the virulence of the disease, e.g. for measles it is about 94% |
|
|
Risk Difference
|
Risk Difference = (ARexposed) – (ARnon-exposed)
|
|
|
Risk Ratio
|
Risk Ratio = (ARexposed) / (ARnon-exposed)
|
|
|
Median Incubation Period
|
• 50th percentile
• observation at the middle of the distribution Example: Time of symptom onset was known for 30 people (N=30) Median = (30+1)/2 = 15.5 observation |
|
|
Passive Surveillance
|
Routine reporting of disease cases seen in health care facilities
Passive surveillance often gathers disease data from all potential reporting health care workers. Health authorities do not stimulate reporting by reminding health care workers to report disease nor providing feedback to individual health workers. |
|
|
Active Surveillance
|
Special search to find disease cases
An active surveillance system provides stimulus to health care workers in the form of individual feedback or other incentives. Often reporting frequency by individual health workers is monitored; health workers who consistently fail to report or complete the forms incorrectly are provided specific feedback to improve their performance. There may also be incentives provided for complete reporting. |
|
|
Sentinel Surveillance
|
Disease-specific reporting systems in defined catchment areas
Instead of attempting to gather surveillance data from all health care workers, a sentinel surveillance system selects, either randomly or intentionally, a small group of health workers from whom to gather data. These health workers then receive greater attention from health authorities than would be possible with universal surveillance. |
|
|
Real-time Surveillance
|
Alert public health care practitioners in early
phases of outbreak Promptly institute case finding and control measures Improve access to treatment with the goal of reducing morbidity and mortality |
|
|
Syndromic Surveillance
|
Adapted CDC definition:
Surveillance using already existing health related data that precede diagnosis and signal a sufficient probability of a case or an outbreak to warrant further public health response Supplements existing surveillance methods TWO SOURCES: Syndromic Surveillance Clinical Data Sources: Emergency Department (ED) data, e.g., chief complaint, total patient volume Emergency medical system call type, e.g., 911 Poison control center call Unexplained deaths Insurance claims or billing data Clinical laboratory or radiology ordering volume Alternative Data Sources: School absenteeism Work absenteeism Over-the-counter medication sales Health-care provider database searches Internet-based health searches by public Animal illness or deaths |
|
|
Analysis of Web Data
|
Best used for surveillance of epidemics and
disease with high prevalence Better suited for use in developed countries with large populations of web search users Pitfall - Disease publicity may increase use of disease related search terms |
|
|
mHealth
|
mHealth is the use of mobile hand-held devices, especially
text and web-enabled cell phones, for the delivery of health information and messagingmHealth Cell phone market penetration in the developed world is around 90 percent, and in the developing world about one-third of that, and growing Android operating system is open-source USES OF mHealth Mobile phones can provide reminders about healthy activities, sources for disease-specific information PROMISE of mHealth Mobile phones are also being explored as a means of… - Tracking patient wellbeing or compliance with treatments - Data collection for public health purposes - Warning of disasters or emergencies (e.g., tsunami, JHU text alerts) CHALLENGES of mHealth Evaluation is difficult How to quantify effectiveness as part of an intervention? How to transition from pilot projects to scaledup programs? Sustainability No standards for mHealth platform integration |
|
|
Magpi
|
Creates web-based data gathering forms that
can be filled out via cell phone from the field Omits data collection on paper and input into electronic databases for sharing and analysis GPS enabled phones allow data to be tagged with geo-coordinates |
|
|
Validity
|
An expression of the
degree to which a measurement measures what it purports to measure |
|
|
Sensitivity
|
The measurement ability of the
test to identify correctly those who have the disease = # positive among those with disease/ total # with disease = Pr ( + | Disease) |
|
|
Specificity
|
The measurement ability of the
test to identify correctly those who do not have the disease # negative among those with no disease/ total # with no disease = Pr ( - | No Disease) |
|
|
Two-Stage Sequential Screening
|
People are identified/defined as having the
disease only if they test positive twice Purpose of re-testing those who screened positive is to have a second chance to rule out the false positives Ruling out more false positives increases specificity Undesirable consequence is that true positives may become false negatives; this decreases sensitivity No need to re-test those who initially screened negative, as they won’t meet definition of disease |
|
|
Simultaneous Screening
|
Purpose of re-testing everyone is to have a
second chance to rule out the false negatives (i.e., identify more positives) Ruling out more false negatives increases sensitivity Undesirable consequence is that true negatives may be mistakenly labeled as false positives; this decreases specificity Those who tested positive the first time really do not need to be re-tested as they already meet the definition of disease, but this is done for convenience with little added cost |
|
|
Sensitivity of test
|
= # identified as positive twice / total # with disease
|
|
|
Specificity of test
|
= # identified as negative by either test / total #
with no disease |
|
|
Net sensitivity
|
= sensitivity test 1 x sensitivity test 2
|
|
|
Net specificity
|
= specificity of test 1 + specificity of test 2 –
(specificity of test 1 x specificity of test 2) |
|
|
Comparison of Simultaneous
and Sequential Testing Versus Using Either Test Alone |
Sequential testing
– “Positive” = positive result on both tests – Net loss in sensitivity – Net gain in specificity Simultaneous testing – “Positive” = positive result on either test – Net gain in sensitivity – Net loss in specificity |
|
|
Positive Predictive Value
|
Of those who test positive, the proportion who actually
have the disease Pr ( Disease | +) = # tested positive among those with disease / total # tested positive synonyms: predictive value positive, PVP, PPV, PV+ PPV is not a fixed characteristic of the test |
|
|
Negative Predictive Value
|
Of those who test negative, the proportion of
patients who are actually free of the disease Pr ( No Disease | -) = # tested negative among those with no disease / total # tested negative synonyms: predictive value negative, PVN, NPV, PV NPV is not a fixed characteristic of the test |
|
|
Reliability
|
Can the result of the test be replicated
if the test is repeated? i.e., consistency of results under repeated examination (by the same people, or similarly trained people, under the same/similar conditions) Synonyms: repeatability, precision |
|
|
Percent agreement
|
Overall percent agreement (concordance)
for test with dichotomous outcomes: Percent agreement = (a + d)/total x 100 |
|
|
Kappa Statistic
|
((Observed Agreement(%))-(Agreement Expected By Chance Alone (%))) / (100% - (Agreement Expected By Chance Alone (%)))
|
|
|
Kappa Statistic Numerator:
|
How much better is the observers’ agreement than by chance alone?
|
|
|
Kappa Statistic Denominator:
|
What is the maximum
the observers could possibly improve agreement over chance alone? |
|
|
Experimental Trial
|
Studies prevention and treatment of disease
Investigator actively manipulates which groups receive the exposure/intervention |
|
|
Observational
|
Studies causes, prevention and treatment for diseases
Investigator passively watches as nature takes its course |
|
|
Cohort
|
Examines multiple health effects of an exposure
Subjects defined by exposure levels and follow for disease occurrence |
|
|
Case-Control
|
Typically examines multiple exposures in relation to a
disease Subjects are defined as cases and controls and exposure histories compared |
|
|
Cross-sectional
|
Examines relationship between exposure and disease
prevalence in a defined population at one point in time |
|
|
Ecologic
|
Examines relationship between exposure and disease
with population-level data rather than individual-level data |
|
|
Goals of analytic studies
|
Determine risk factors and causes of disease
Evaluate preventive and therapeutic interventions that alter the course of disease |
|
|
Populations in the context of study designs:
|
Target – The population about which inferences
are desired Source – The source of subjects for a particular study, subset of target population, can be enumerated Study – Subset of source population, the subjects who actually participate in study |
|
|
Unit of Observation
|
1. Group (of individuals) as unit
– Examples: Lecture hall of students, city, country – Ecologic study 2. Individual as unit – Examples: Person or event (e.g., pregnancy) |
|
|
Allocation of Exposure Under Study
|
1. Experimental
– Performed by researcher – May or may not be random – Example: Clinical trial 2. Non-experimental (i.e., observational) – By nature, self-selection, imposed by others, etc – Researcher does not want to interfere with exposure allocation |
|
|
Timing of Observations
|
1. Longitudinal recording of exposures and
outcomes over time (i.e., data collection at least two time points) 2. Cross-sectional - Information on exposures, outcomes, other factors collected at the same time (i.e., data collection at only one time point) - Prevalence data - No attempt to reconstruct exposure history |
|
|
Sampling of Source Population
|
1. By exposure status
– Exposed versus unexposed – Cohort studies 2. By outcome status – Disease (i.e., case) versus no disease (i.e., control) – Case control studies |
|
|
Type of Data
|
1. Primary data – Collected for the purpose of
a study – Example: Questionnaires – Large studies may have various exposures and outcomes 2. Secondary data – Collected primarily for other purposes – Example: Medical records – Use with caution! |
|
|
Ecologic Study
|
Association based on sample of
groups, rather than sample of individuals Distinguished by the fact that groups are the “unit of observation” |
|
|
Ecologic Studies
|
Examine rates of disease in relation to a
population-level exposure factor -Summaries of individual population members, environmental measures, global measures (e.g., health care system) Populations/groups may be defined by time or place or both Measure of association is often the correlation coefficient (r) - not an estimate of risk |
|
|
Advantages in Ecologic Studies
|
Can usually be completed relatively quickly if
based on available data Inexpensive if data are available Good for hypothesis generation Can examine wide range of exposure levels |
|
|
Limitations in Ecologic Studies
|
Individuals who are exposed may not be
the same as those with relevant outcome Cannot adjust for other extraneous factors (i.e., lack of information on important variables) Can be difficult to interpret, as data are crude by nature Cannot establish temporality or causation Key Limitation: Ecologic Fallacy: The bias that may occur because an association observed between variables on the aggregate/group level does not necessarily represent the association that exists at the individual level. Therefore, we cannot ascribe group characteristics to individual members of the group. |
|
|
Cross-sectional Study
|
Observational / non-experimental study
Individual is unit of observation Data on exposures, outcomes, other factors collected from defined population at the same time, and at a single point in time Participants are often selected without regard to exposure or outcome status Advantages: - Generate inferences and hypotheses - Quick - Low cost - Highly generalizable, when based on sample of general population Often used as basis for public health policy and programming decisions Example: NHANES (National Health and Nutrition Examination Survey) Limitations of Cross-sectional studies Cannot establish temporality Cannot determine causation May miss prevalent cases of short duration Healthy worker effect |
|
|
Internal Validity
|
Was the study well done?
Are the findings valid? Need to consider… - If there are major methodological problems - If findings could be due to bias, confounding, random error **Important – Need to establish sound internal validity before you consider generalizing the results beyond the study population |
|
|
External Validity
|
Aka “generalizability” to target population
To what extent are the participants you have studied representative of all people with the outcome of interest? Need to examine… - Who did not participate in the study - Characteristics of study participants that might preclude you from generalizing the study results to others who were not in the study |
|
|
Clinical Trial
|
Controlled study that prospectively evaluates
the effect of an allocated exposure (i.e., intervention) on the outcome of interest Effects in which we’re interested: Safety, efficacy, effectiveness Considered “gold standard” of epi studies Individual is unit of observation Experimental design Follow participants over time -Collect data from at least two time points (e.g., before exposure, after exposure) Clinical trials are justified when uncertainty exists regarding the effectiveness of a treatment (aka, EQUIPOISE) EQUIPOISE: Legitimate uncertainty or indecision as to choice or course of action… because of an unknown balance of benefits and risks The researcher must believe that… (1) what a study proposes to accomplish has an excellent chance of being helpful (i.e., will contribute to generalized knowledge) and (2) he/she must have justified doubt about the relative benefits of the comparison treatment (which may be the “standard of care” treatment) When Clinical Trials Are Impossible (or Nearly Impossible): Adverse Exposures (e.g., cigarettes, other toxins) Rare Outcomes (e.g., Reye’s Syndrome) Intervention Already in Wide Use (e.g., intensive care unit (ICU) medical care) |
|
|
Basic Protocol in a Clinical Trial
|
1. Obtain approval of Institutional Review
Board (IRB) 2. Enroll participants 3. Gather “baseline” data from participants 4. Allocate exposure to participants 5. Follow-up participants to collect data on outcome 6. Conduct data analyses 7. Report findings |
|
|
Randomized Assignment
|
Unstratified by any variables
– Assignment is completely random – Balanced in the long run, but may be unbalanced in the short run Stratified by key variables –Ensures balance within subgroups defined by key variables before randomization –Stratification variable should be strongly related to outcome (e.g., gender, risk level) |
|
|
Why Randomize Exposure Allocation?
|
Ensure that exposure assignment is unbiased
Produce similar groups at baseline by known and unknown factors Goal: any difference between the groups at the end of the study will be the result of the exposure / treatment / intervention Minimizes the threat of selection bias Avoids confounding by indication |
|
|
Confounding by Indication in Observational Studies
|
A bias when patients with the worst prognosis
are allocated preferentially to a particular treatment. High risk hypertensive patients are more likely to have adverse outcomes. High risk hypertensive patients are more likely to be prescribed calcium channel blockers (than other drugs hypertensive drugs). Observational studies show that calcium channel blockers are associated with more adverse outcomes |
|
|
Factorial Design
|
Potentially economical way to test two
treatments simultaneously, if their modes of action are independent OR Method to test for treatment synergy - Is the effect of the combined treatment different than expected based on the effects of the treatments alone? |
|
|
“Cross Over"
|
Crossing from one treatment group to the other
Unplanned crossover: treatment non-adherence procedures/protocol should be designed to minimize Planned crossover design: administration of treatments one after the other in random (or specified) order treatment may be followed by a “washout” period Planned “Cross Over” -Each participant serves as his/her own control - creates comparability between treatment groups Feasible only if… - Outcomes are recurrent, and - No “carryover” treatment effect after “washout” period Randomize order of treatments |
|
|
Who to Mask/Blind in the Study and Why
|
Participants: Quantify placebo effects
Physicians: Uniform care apart from study Data Collectors: Uniform outcome ascertainment Data Analysts: Reduce threat of analytic bias |
|
|
Partial Masking
|
In some circumstances masking of participants
and/or physicians may be impossible or unethical (Surgery, behavior modification) In this setting, others can generally still be masked: Data collectors Adjudicators Laboratory measurements Data analysts |
|
|
Approaches to Non-compliance
|
Run-in period / pilot study – randomize subjects
after a trial period assessing compliance Monitor noncompliance: - Interview patients, count pills - Medication bottle devices - Blood or urine tests - Directly observed treatment In the setting of non-compliance, the observed effect will likely be smaller than the true effect |
|
|
Intention to Treat (ITT) Approach
|
Analysis by assigned treatment regardless of
the observed course of treatment Maintains initial balance from randomization Highlights problems from adverse effects Conservative approach Strongly recommended as primary approach |
|
|
Number needed to treat (NNT)
|
Number of patients who would need to be treated
to prevent one outcome NNT = 1 / (outcome frequency in untreated group – outcome frequency in treated group) Small NNT is good Estimates often presented with 95% confidence intervals |
|
|
Number needed to harm (NNH)
|
Number of patients who would need to be treated
to cause one patient to be harmed (by treatmentrelated adverse events or side effects) NNH = 1 / (adverse event frequency in treated group – adverse event frequency in untreated group) Large NNH is good Estimates often presented with 95% confidence intervals |
|
|
Safety and Stopping
|
“Stopping rule”
A rule set before the start of the trial that specifies a limit for the observed treatment difference for the primary outcome which, if exceeded, automatically leads to the termination of the treatment or control arm (depending on direction of the difference) |
|
|
When to stop a clinical trial before
its scheduled end? |
1. Clear evidence of benefit
2. Clear evidence of harm --> Importance of plans to monitor the progress of a trial |
|
|
Advantages of CTs
|
"Gold standard” (Randomization) of epi studies
Designed to minimize bias “Highest quality evidence available” Results may be combined into systematic reviews |
|
|
Why CTs Can Be Difficult
|
Hard to find and recruit the right people
Great responsibility on the investigator(s), need for tremendous documentation, cost May take years for outcomes to develop People are free to do as they please: - Some assigned to treatment don’t adhere - Some assigned to control seek treatment - Some drop out of the trial completely (loss-tofollow-up) |
|
|
Limitations of CTs
|
Cost
Limited external validity - Country, patient characteristics, study procedures, outcome measures Time to conduct and to publish findings Difficult to study rare events Difficult to study distant events Narrowing of the studied question |
|
|
Phases in Clinical Trials
|
I Evaluate safety, dosage-->10-20 healthy volunteers -->Unexpected side effects may occur
II Evaluate efficacy --> About 200 patients-->Most drugs fail in Phase II due to being less efficacious than anticipated III Evaluate effectiveness--> More than 1,000 patients-->Likelihood to detect rare side effects increases with number of patients IV Evaluate long-term safety and effectiveness--> 1,000s of patients, “real life” evaluation outside of research environment-->Previously untested groups may show adverse reactions, postmarketing surveillance |
|
|
Cohort Study
|
Observational epidemiologic study that follows
groups with common characteristics over time Terms associated with cohort studies: followup, incidence, longitudinal study Participants defined by exposure status, then followed for outcomes of interest |
|
|
Key Parameters of Cohort Studies
|
Individual is unit of observation
Observational design Follow participants over time -Collect data from at least two time points Participants selected based on exposure status, and all are “at risk” for the main outcome at baseline |
|
|
When is a Cohort Study Warranted?
|
Good evidence of an association of the disease
with a certain exposure Exposure is rare, but incidence of disease among exposed is high Time between exposure and disease is short Attrition of study population can be minimized |
|
|
Timing of Cohort Studies
|
Prospective – Looking forward in time
Participants grouped based on past or current exposures and followed forward for outcome Retrospective – Looking back in time Both exposures and outcomes have already occurred when study begins, data collection is based on existing records (historical) Ambidirectional – Looking both forward and back in time |
|
|
Cohort Sources of Information
|
Interviews
Medical and employment records Direct physical exams Lab tests and biological specimens Environmental monitoring And remember… Each source has advantages and disadvantages Need comparable procedures for data collection in exposed and unexposed groups, including standard outcome definitions and masking |
|
|
Losses to follow-up (LTF)
|
Losses to follow-up (LTF) decrease sample size
LTF may be more like to develop outcome! Collection of data at baseline on participant, friends, relatives, physicians Regular contact via mail, phone, home visits If possible LTF – Then, “Address Correction Requested,” contacts provided at baseline, directories, national registries, commercial companies |
|
|
Cohort Study Data Analysis Approach
|
Primary objective – Compare disease
occurrence in exposed and unexposed groups -->Incidence rates, cumulative incidence Person-time Induction period – Interval between action of a cause (e.g., exposure) and disease onset Latent period – Interval between disease onset and clinical diagnosis |
|
|
Disadvantages of Cohort Studies
|
Inefficient for rare outcomes
Poor info on exposures and other key variables (retrospective) Expensive and time consuming (particularly prospective) Inefficient for diseases with long induction and latent periods (prospective) More vulnerable to bias (retrospective) |
|
|
Advantages of Cohort Studies
|
Efficient for rare exposures
Good information on exposures (prospective) Can evaluate multiple effects of an exposure Efficient for diseases with long induction and latent periods (retrospective) Less vulnerable to bias (prospective) Can directly measure disease incidence or risk Clear temporal relationship between exposure and outcome (prospective) |
|
|
Case-Control Study
|
Observational epidemiologic study of persons
with the outcome of interest (“cases”) and without (“controls”) that examines the presence of particular attributes (“exposures”) in the two groups Participants defined by outcome status, then exposures of interest are assessed Highly efficient study design |
|
|
Key Parameters of Case-Control Studies
|
Individual is unit of observation
Observational design No follow-up of participants over time (i.e., the investigator does not directly collect data from the participant over time) - Collect data at one time point Participants selected based on outcome status, then exposures are assessed |
|
|
Types of Case-Control Studies
|
Population-based:
-Participants identified from within a source population -No pre-existing study infrastructure -Example: Inpatients at Johns Hopkins Hospital today Nested: -Source population is ongoing cohort study -Benefits of cohort and case-control study designs -Example: Participants in ALIVE cohort study |
|
|
Selection of Cases
Incident versus prevalent cases(case control) |
Incidence, if studying causes of disease
Prevalence, if study duration of disease Might not have a choice, so prevalence |
|
|
Ratio of Controls to Cases
|
Can increase the statistical power of the study
to detect an association by increasing the size of the control group Up to a ratio of 4 controls : 1 case will increase power Beyond 4:1, not considered worthwhile due to costs |
|
|
Challenge in Case-Control Studies
|
Cases and controls may differ in characteristics or
exposures other than the one targeted for study -Is study finding due to exposure, or due to differences between cases and controls? Solution via study design: Match cases and control for factors about which you’re concerned Matching: Process of selecting the controls so they are similar to the cases in certain characteristics (e.g., age, race, sex, etc) |
|
|
Matching (Case Control)
|
Group matching (frequency matching)
Proportion of controls with a certain characteristic is identical to the proportion of cases with the same characteristic # of controls may be less than # of cases Individual matching (matched pairs) For each case, at least one control is selected who is similar to the case for the characteristic of interest Problems with Matching: Practical –A lot of matching may make it impossible to find a suitable control Conceptual – Once you match controls to cases by a certain characteristic, then you cannot study that characteristic in your analysis So, only match on factors you are convinced are risk factors for the disease (and you therefore don’t need to investigate) |
|
|
Case-Control Study
Data Analysis |
Challenge: Often, investigators do not know
the size of the total population that produced the cases Assumption: Cases and Controls Originate From Same Hypothetical Source Population So, we don’t know how many people were “at risk” for becoming a case (i.e., we don’t know the denominator), so we can’t calculate incidence, prevalence, associated measures But, we can calculate the odds! Odds of event = probability (p) the event will occur divided by the probability the event will not occur = p / (1-p) |
|
|
Disadvantages of Case-Control Studies
|
Inefficient for rare exposures
May have poor info on exposures because of retrospective Vulnerable to bias because of retrospective Cannot establish temporal relationship between exposure and disease |
|
|
Advantages of Case-Control Studies
|
Efficiency
-Less time, less money than cohort studies, experimental studies Efficient for rare diseases Efficient for disease with long induction and latent periods Can evaluate multiple exposures in relation to outcome (so, good for diseases about which little is known) |
|
|
When is the OR a good estimate of the RR? (CC study)
|
When the cases are representative of all people
with the disease in the population from which the cases were drawn, with regard to history of the exposure. When the controls are representative of all people without the disease in the population from which the cases were drawn, with regard to history of exposure. When the disease is not frequent (i.e., rare). |
|
|
Necessary Causes
|
If a disease is defined by the presence of an
agent, that agent is necessary by definition. Example: Tuberculosis can only be caused by the tubercle bacillus. Contrast: Hepatitis can be caused by many viruses, but Hepatitis C is caused only by the Hepatitis C virus. |
|
|
Any Given Cause May Be Necessary,
Sufficient, Both, or Neither |
Necessary and sufficient = cause is always
present with disease; nothing but cause is needed to result in disease –Example: measles virus and measles Necessary and not sufficient = cause is always present with disease, but disease is not always present with cause –Example: HPV and cervical cancer Not necessary and sufficient = cause may or may not be present with disease, nothing but cause is needed to result in disease –Example: High-dose exposure to pesticides or ionizing radiation and sterility in men Not necessary and not sufficient = cause may or may not be present with disease; if cause is present with disease, then some additional factor must also be present –Example: sedentary lifestyle and coronary heart disease |
|
|
Necessary Conditions
|
“X is a necessary condition for Y” =
If we don't have X, then we won't have Y OR Without X, you won't have Y To say that X is a necessary condition for Y does not mean that X guarantees Y. |
|
|
Sufficient Conditions
|
“X is a sufficient condition for Y” =
if we have X, we know that Y must follow OR X guarantees Y |
|
|
Epidemiologic Guidelines for Establishing
a Cause-Effect Relationship |
Temporal sequence
Strength of the association Dose response relationship / biologic gradient Consistency of the association / replication Coherence (biologic plausibility) Specificity of the association Experiment (cessation of exposure) Analogy Consideration of alternate explanations |
|
|
Temporal Sequence
|
Study designs that can establish the potential
“cause” (risk factor or treatment) precedes the disease include: -Clinical trial -Cohort study Study designs that cannot establish that the potential “cause” preceded the disease include: -Cross-sectional study -Population-based case-control study -Ecologic study |
|
|
Probabilistic Causality
|
The strength of a causal relationship is
assessed by the magnitude of its measures of association. The greater the RR or OR, the closer the cause is to being necessary and/or sufficient. |
|
|
Confidence Interval (CI)
|
A computed interval that, upon repeated
sampling, has a given probability (e.g., 95%) of containing the true value of a statistical parameter (e.g., ratio, proportion, rate). In other words… For a 95% confidence interval, if a single population is repeatedly sampled, then 95% of the samples would capture the true value of the population parameter. Expresses the precision of the point estimate - More narrow interval = more precision - Less narrow interval = less precision Calculated with predetermined significance level, α (alpha), which is often set at 0.05 |
|
|
Selection Bias
|
Error due to systematic differences in
characteristics between those who take part in a study and those who do not The problem is that the association between exposure and outcome may differ between those who participate in the study and those who do no The measure of association is distorted due to procedures used to select subjects and from factors that influence study participation Usually inferred, rather than observed Self-selection bias • Selection of controls – Healthy worker effect • Post-entry exclusion bias |
|
|
Information Bias
|
A flaw in collecting or measuring exposure
or outcome data that results in different quality/accuracy of information between comparison groups Can result in distortion of the measure of association Information Bias Types Misclassification - Differential and non-differential with respect to exposure and outcome status • Recall bias • Reporting bias • Interviewer bias • Surveillance bias / biased follow-up |
|
|
Distinguishing between random error (i.e.,
chance) and systematic error (i.e., bias) |
Imagine that a given study could be
increased in size until it was infinitely large Some errors would be reduced to zero; these are the random errors Other errors would not affected by increasing the size of the study; these are systematic errors or bias |
|
|
Confounding
|
A situation in which the measure of association
is distorted because of the relationship between the exposure and a third factor that also influences the outcome. It is a true phenomenon, and not an error in the study. Distortion in a measure of association due to a third variable that: 1. Is associated with the exposure 2. Influences the outcome 3. Is not in the causal pathway (i.e., not an intermediate step between exposure and outcome) |
|
|
Confounding can be controlled for…
|
1. In the study design
• Matching in a case-control study • Randomization in a clinical trial 2. In the data analysis • Stratification • “Adjustment” (e.g., age adjustment) • Multivariate regression models BUT, we must have collected the data! |
|
|
Interaction (i.e., Effect Modification)
|
If the size of the association between an
exposure and an outcome is changed or modified by the level of a third variable, interaction is said to be present Interaction is also called “effect measure modification” Classic examples: age, immunization |
|
|
Model for Additive Effect
|
Combined Total Risk of A and B =
Baseline Risk + Attributable Risk (A) + Attributable Risk (B) Combined Effect of A and B = Attributable Risk (A) + Attributable Risk (B) |
|
|
Model for Multiplicative Effect
|
Combined Total Risk of A and B =
Baseline Risk x Relative Risk (A) x Relative Risk (B) Combined Effect of A and B = Relative Risk (A) x Relative Risk (B) |
|
|
Possible Types of Effect Modification
|
Antagonism: Combined effect less than
predicted by the model (negative interaction) Synergism: Combined effect greater than predicted by the model (positive interaction) |
|
|
Comparison of
Confounding and Effect Modification |
Confounding – Association between exposure and
outcome is distorted by a third variable related to the exposure and outcome Effect modification – The association between exposure and outcome is modified by levels of a third variable |
|
|
Distinguishing between
confounding and effect modification |
1. Make list of potential confounders and effect
modifiers (literature review, data collected) 2. Calculate “crude” measure of association for exposure and outcome of interest 3. Stratify association by levels of potential confounder or potential effect modifier 4. Compare crude vs. stratum-specific associations… If stratified associations are relatively similar across strata AND different from crude, then you have confounding If stratified associations differ across strata AND crude association seems to be weighed-average of stratum-specific associations (i.e., crude measure is between stratum-specific measures), then you have effect modification |
|
|
meta-analysis
|
a way of combining data across research studies
Aim is to integrate the findings of separate studies and to identify overall patterns in the studies Statistical analysis of results, examining sources of differences in results among studies, leading to quantitative summary of the results Pooling of results from a set of studies may increase statistical power Quantitative and qualitative components |
|
|
Systematic review
|
A summary of the literature
Also known as systematic research synthesis Focuses on peer-reviewed publications about specific health problem Rigorous, standardized methods for selecting and assessing articles Does not include a quantitative summary of the results across studies (unlike metaanalyses) |
|
|
Years of Potential Life Lost (YPLL)
|
Measures premature mortality
Also known as potential years of life lost (PYLL) Estimate of the average years a person would have lived if he/she had not died prematurely Alternative to mortality rate that gives more weight to deaths that occur among younger people |
|
|
Disability-adjusted life year (DALY)
|
Measures disease burden
Expressed as a year lost due to ill-health, disability or early death in a defined population Extends the concept of YPLL to include equivalent years of “healthy” life lost by virtue of being in states of poor health or disability Essentially, mortality and morbidity are combined into a single, common metric |
|
|
Quality adjusted life year (QALY)
|
measures disease burden as well
Includes both the quality and the quantity of life lived Adjustment of life expectancy that takes into account existence of chronic conditions causing impairment, disability, and/or handicap Used for assessing the monetary cost value of a medical intervention |
|
|
Cost-effectiveness analysis
focuses on economic costs of an intervention to achieve desired outcomes |
Seeks to estimate the costs and effectiveness
of an activity (or between similar alternative activities) to determine the degree to which it (they) will obtain the desired outcomes. The preferred action is one that requires the least cost to produce a given level of effectiveness. |
|
|
Cost-utility analysis
focuses on “utility-based” outcomes |
Economic evaluation in which outcomes of
alterative interventions are expressed in terms of a single “utility-based” unit of measurement (e.g., QALY). Often used in health technology assessment. Utility – The value of a particular health state, usually expressed on a scale from 0 to 10. |
|
|
Kauffman Best Practices Project Final
Report Inclusion Criteria |
1. The treatment has a sound theoretical basis
in generally accepted psychological principles indicating that it would be effective in treating at least some problems known to be outcomes of child abuse. 2. The treatment is generally accepted in clinical practice as appropriate for use with abused children, their parents, and/or their families. 3. A substantial clinical-anecdotal literature exists indicating the treatment’s value with abused children, their parents, and/or their families from a variety of cultural and ethnic backgrounds. 4. There is no clinical or empirical evidence, or theoretical basis indicating that the treatment constitutes a substantial risk of harm to those receiving it, compared to its likely benefits. 5. The treatment has at least one randomized, controlled treatment outcome study indicating its efficacy with abused children and/or their families. 6. If multiple treatment outcome studies have been conducted, the overall weight of evidence supports the efficacy of the treatment. |
|
|
The National Registry of Evidence-based
Programs and Practices (NREPP) |
Registry of reviewed mental health and substance
abuse interventions • General info on the intervention • Description of research outcomes • Ratings for quality of research and readiness for dissemination • List of studies and materials reviewed • Contact info to obtain more information |
|
|
The Cochrane Collaboration prepares
systematic reviews to inform healthcare |
Prepares systematic reviews to help
healthcare providers, policy-makers, patients, their advocates and carers, make wellinformed decisions about health care • Prepares records of randomized trials across the world |
|
|
“The Community Guide”
|
a collection of reviewed intervention findings
Official collection of all Community Preventive Services Task Force findings and the systematic reviews on which they are based. Resource with many uses because it is based on a scientific systematic review process. |
|
|
Comparative Effectiveness
Research (CER) |
Conduct and synthesis of research comparing
the benefits and harms of different interventions and strategies to prevent, diagnose, treat, and monitor health conditions in "real world" settings. Purpose: To improve health outcomes by developing and disseminating evidence-based information to patients, clinicians, and other decision-makers, responding to their expressed needs, about which interventions are most effective for which patients under specific circumstances. |
|
|
CER involves several key elements
|
Assess a comprehensive array of health-related
outcomes for diverse patient populations and subgroups. Interventions may include medications, procedures, medical and assistive devices and technologies, diagnostic testing, behavioral change, and delivery system strategies. Necessitates the development, expansion, and use of a variety of data sources and methods. |
|
|
The three Eff’s
|
• Efficacy: does the agent or intervention work
under ideal laboratory conditions? • Effectiveness: does the agent work in real life conditions? • Efficiency: what is the cost-benefit ratio? |